252SÍNTESE ANUAL DA AGRICULTURA DESANTA CATARINA <strong>2003</strong>-<strong>2004</strong>dução oriun<strong>da</strong> <strong>de</strong> matéria-prima extrativavem se reduzindo ano a ano e estima-seque em <strong>2003</strong> tenha sido menordo que aquela proveniente <strong>da</strong> silvicultura.Há uma níti<strong>da</strong> tendência <strong>de</strong> substituiçãogra<strong>da</strong>tiva <strong>da</strong> mata nativa pelo cultivoflorestal na produção <strong>de</strong> carvão.O volume <strong>de</strong> produção <strong>de</strong> lenha tem-semantido ao redor <strong>de</strong> seis milhões <strong>de</strong> m 3por ano, dois terços dos quais <strong>de</strong> origemcultiva<strong>da</strong>, especialmente <strong>de</strong> espécies dogênero eucaliptus. De modo semelhanteao carvão, observa-se uma forte tendência<strong>de</strong> redução <strong>da</strong> extração <strong>de</strong> lenha <strong>de</strong>matas nativas no estado.<strong>Santa</strong> <strong>Catarina</strong> produziu 117 mil tonela<strong>da</strong>s<strong>de</strong> erva-mate em 2002, 40% a maisque em 2001. A produção extrativa temsido bastante irregular nos últimos anos,variando <strong>de</strong> 33 mil a 70 mil tonela<strong>da</strong>s porano. São mais <strong>de</strong> 100 os municípios <strong>de</strong><strong>Santa</strong> <strong>Catarina</strong> que produzem erva-mateextrativa. As maiores produções ocorremno planalto norte, <strong>de</strong>stacando-se o município<strong>de</strong> Canoinhas. Já a produção <strong>de</strong>erva-mate cultiva<strong>da</strong> aumentou até 1999,atingindo mais <strong>de</strong> 70 mil tonela<strong>da</strong>s, masa partir <strong>de</strong> 2000 passou a <strong>de</strong>clinar e em2002 foi <strong>de</strong> apenas 45,6 mil tonela<strong>da</strong>s.A produção catarinense <strong>de</strong> palmito é, nasua gran<strong>de</strong> maioria, cultiva<strong>da</strong> e apresentatendência <strong>de</strong> crescimento. Em 2002,foi <strong>de</strong> 1.259 tonela<strong>da</strong>s, 13% a menosque em 2001. A maior parte é <strong>de</strong> cultivo<strong>da</strong> palmeira real nas regiões litorâneas,espécie que vem apresentando umaboa aceitação entre os consumidores, oque <strong>de</strong>ve estimular a realização <strong>de</strong> novosplantios.O programa <strong>de</strong> incentivo ao plantio e manejodo palmito juçara, lançado este anoem caráter piloto pelo governo do estado,po<strong>de</strong>rá vir a se constituir em importanteembrião para a expansão <strong>da</strong>s possibili<strong>da</strong><strong>de</strong>s<strong>de</strong> aproveitamento alimentar <strong>da</strong> espécieem bases sustentáveis.SETOR FLORESTAL
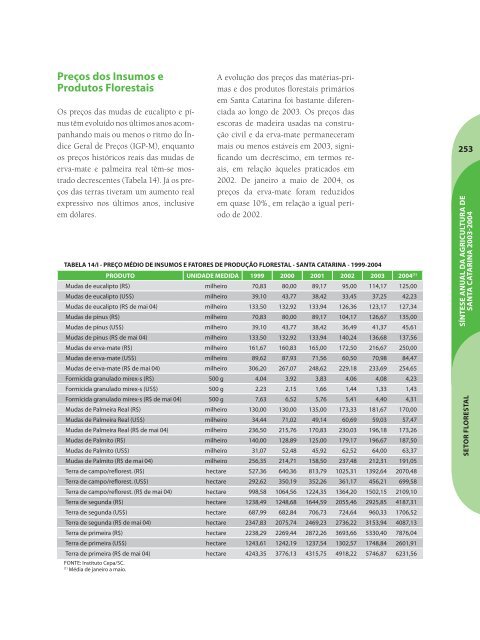
Preços dos Insumos eProdutos FlorestaisOs preços <strong>da</strong>s mu<strong>da</strong>s <strong>de</strong> eucalipto e pínustêm evoluído nos últimos anos acompanhandomais ou menos o ritmo do ÍndiceGeral <strong>de</strong> Preços (IGP-M), enquantoos preços históricos reais <strong>da</strong>s mu<strong>da</strong>s <strong>de</strong>erva-mate e palmeira real têm-se mostrado<strong>de</strong>crescentes (Tabela 14). Já os preços<strong>da</strong>s terras tiveram um aumento realexpressivo nos últimos anos, inclusiveem dólares.A evolução dos preços <strong>da</strong>s matérias-primase dos produtos florestais primáriosem <strong>Santa</strong> <strong>Catarina</strong> foi bastante diferencia<strong>da</strong>ao longo <strong>de</strong> <strong>2003</strong>. Os preços <strong>da</strong>sescoras <strong>de</strong> ma<strong>de</strong>ira usa<strong>da</strong>s na construçãocivil e <strong>da</strong> erva-mate permanecerammais ou menos estáveis em <strong>2003</strong>, significandoum <strong>de</strong>créscimo, em termos reais,em relação àqueles praticados em2002. De janeiro a maio <strong>de</strong> <strong>2004</strong>, ospreços <strong>da</strong> erva-mate foram reduzidosem quase 10%, em relação a igual período<strong>de</strong> 2002.TABELA 14/I - PREÇO MÉDIO DE INSUMOS E FATORES DE PRODUÇÃO FLORESTAL - SANTA CATARINA - 1999-<strong>2004</strong>PRODUTO UNIDADE MEDIDA 1999 2000 2001 2002 <strong>2003</strong> <strong>2004</strong> (1)Mu<strong>da</strong>s <strong>de</strong> eucalipto (R$) milheiro 70,83 80,00 89,17 95,00 114,17 125,00Mu<strong>da</strong>s <strong>de</strong> eucalipto (US$) milheiro 39,10 43,77 38,42 33,45 37,25 42,23Mu<strong>da</strong>s <strong>de</strong> eucalipto (R$ <strong>de</strong> mai 04) milheiro 133,50 132,92 133,94 126,36 123,17 127,34Mu<strong>da</strong>s <strong>de</strong> pínus (R$) milheiro 70,83 80,00 89,17 104,17 126,67 135,00Mu<strong>da</strong>s <strong>de</strong> pínus (US$) milheiro 39,10 43,77 38,42 36,49 41,37 45,61Mu<strong>da</strong>s <strong>de</strong> pínus (R$ <strong>de</strong> mai 04) milheiro 133,50 132,92 133,94 140,24 136,68 137,56Mu<strong>da</strong>s <strong>de</strong> erva-mate (R$) milheiro 161,67 160,83 165,00 172,50 216,67 250,00Mu<strong>da</strong>s <strong>de</strong> erva-mate (US$) milheiro 89,62 87,93 71,56 60,50 70,98 84,47Mu<strong>da</strong>s <strong>de</strong> erva-mate (R$ <strong>de</strong> mai 04) milheiro 306,20 267,07 248,62 229,18 233,69 254,65Formici<strong>da</strong> granulado mirex-s (R$) 500 g 4,04 3,92 3,83 4,06 4,08 4,23Formici<strong>da</strong> granulado mirex-s (US$) 500 g 2,23 2,15 1,66 1,44 1,33 1,43Formici<strong>da</strong> granulado mirex-s (R$ <strong>de</strong> mai 04) 500 g 7,63 6,52 5,76 5,41 4,40 4,31Mu<strong>da</strong>s <strong>de</strong> Palmeira Real (R$) milheiro 130,00 130,00 135,00 173,33 181,67 170,00Mu<strong>da</strong>s <strong>de</strong> Palmeira Real (US$) milheiro 34,44 71,02 49,14 60,69 59,03 57,47Mu<strong>da</strong>s <strong>de</strong> Palmeira Real (R$ <strong>de</strong> mai 04) milheiro 236,50 215,76 170,83 230,03 196,18 173,26Mu<strong>da</strong>s <strong>de</strong> Palmito (R$) milheiro 140,00 128,89 125,00 179,17 196,67 187,50Mu<strong>da</strong>s <strong>de</strong> Palmito (US$) milheiro 31,07 52,48 45,92 62,52 64,00 63,37Mu<strong>da</strong>s <strong>de</strong> Palmito (R$ <strong>de</strong> mai 04) milheiro 256,35 214,71 158,50 237,48 212,31 191,05Terra <strong>de</strong> campo/reflorest. (R$) hectare 527,36 640,36 813,79 1025,31 1392,64 2070,48Terra <strong>de</strong> campo/reflorest. (US$) hectare 292,62 350,19 352,26 361,17 456,21 699,58Terra <strong>de</strong> campo/reflorest. (R$ <strong>de</strong> mai 04) hectare 998,58 1064,56 1224,35 1364,20 1502,15 2109,10Terra <strong>de</strong> segun<strong>da</strong> (R$) hectare 1238,49 1248,68 1644,59 2055,46 2925,85 4187,31Terra <strong>de</strong> segun<strong>da</strong> (US$) hectare 687,99 682,84 706,73 724,64 960,33 1706,52Terra <strong>de</strong> segun<strong>da</strong> (R$ <strong>de</strong> mai 04) hectare 2347,83 2075,74 2469,23 2736,22 3153,94 4087,13Terra <strong>de</strong> primeira (R$) hectare 2238,29 2269,44 2872,26 3693,66 5330,40 7876,04Terra <strong>de</strong> primeira (US$) hectare 1243,61 1242,19 1237,54 1302,57 1748,84 2601,91Terra <strong>de</strong> primeira (R$ <strong>de</strong> mai 04) hectare 4243,35 3776,13 4315,75 4918,22 5746,87 6231,56FONTE: Instituto <strong>Cepa</strong>/SC.(1)Média <strong>de</strong> janeiro a maio.253SÍNTESE ANUAL DA AGRICULTURA DESANTA CATARINA <strong>2003</strong>-<strong>2004</strong>SETOR FLORESTAL
- Page 1 and 2:
INSTITUTO DE PLANEJAMENTO E ECONOMI
- Page 3 and 4:
APRESENTAÇÃOSÍNTESE ANUAL DA AGR
- Page 5 and 6:
SUMÁRIOPARTE IDESEMPENHO DO AGRONE
- Page 7 and 8:
CONVENÇÕES= números entre parên
- Page 9:
Parte1
- Page 12 and 13:
12SÍNTESE ANUAL DA AGRICULTURA DES
- Page 14 and 15:
14SÍNTESE ANUAL DA AGRICULTURA DES
- Page 16 and 17:
16SÍNTESE ANUAL DA AGRICULTURA DES
- Page 18 and 19:
TABELA 2/I - VALOR BRUTO DA PRODUÇ
- Page 20 and 21:
20SÍNTESE ANUAL DA AGRICULTURA DES
- Page 22 and 23:
22SÍNTESE ANUAL DA AGRICULTURA DES
- Page 24 and 25:
24SÍNTESE ANUAL DA AGRICULTURA DES
- Page 26 and 27:
TABELA 1/I - ALHO - ÁREA PLANTADA,
- Page 28 and 29:
28SÍNTESE ANUAL DA AGRICULTURA DES
- Page 30 and 31:
30SÍNTESE ANUAL DA AGRICULTURA DES
- Page 32 and 33:
32SÍNTESE ANUAL DA AGRICULTURA DES
- Page 34 and 35:
TABELA 1/I - ARROZ - EVOLUÇÃO MUN
- Page 36 and 37:
36SÍNTESE ANUAL DA AGRICULTURA DES
- Page 38 and 39:
38TABELA 7/I - ARROZ - RENDIMENTO M
- Page 40 and 41:
Outra, de maior repercussão, resul
- Page 42 and 43:
42SÍNTESE ANUAL DA AGRICULTURA DES
- Page 44 and 45:
44SÍNTESE ANUAL DA AGRICULTURA DES
- Page 46 and 47:
TABELA 1/I - BANANA - EVOLUÇÃO NO
- Page 48 and 49:
48TABELA 4/I - FRUTAS - CONSUMO PER
- Page 50 and 51:
50SÍNTESE ANUAL DA AGRICULTURA DES
- Page 52 and 53:
TABELA 9/I - BANANA - EVOLUÇÃO DO
- Page 54 and 55:
54SÍNTESE ANUAL DA AGRICULTURA DES
- Page 56 and 57:
56BATATASÍNTESE ANUAL DA AGRICULTU
- Page 58 and 59:
TABELA 2/I - BATATA - EXPECTATIVA D
- Page 60 and 61:
60CEBOLASÍNTESE ANUAL DA AGRICULTU
- Page 62 and 63:
62SÍNTESE ANUAL DA AGRICULTURA DES
- Page 64 and 65:
64SÍNTESE ANUAL DA AGRICULTURA DES
- Page 66 and 67:
66TABELA 1/I - FEIJÕES SECOS - EVO
- Page 68 and 69:
68SÍNTESE ANUAL DA AGRICULTURA DES
- Page 70 and 71:
70SÍNTESE ANUAL DA AGRICULTURA DES
- Page 72 and 73:
72SÍNTESE ANUAL DA AGRICULTURA DES
- Page 74 and 75:
74SÍNTESE ANUAL DA AGRICULTURA DES
- Page 76 and 77:
76SÍNTESE ANUAL DA AGRICULTURA DES
- Page 78 and 79:
plantio da safrinha, que, por sua v
- Page 80 and 81:
80FUMOSÍNTESE ANUAL DA AGRICULTURA
- Page 82 and 83:
82SÍNTESE ANUAL DA AGRICULTURA DES
- Page 84 and 85:
84SÍNTESE ANUAL DA AGRICULTURA DES
- Page 86 and 87:
86SÍNTESE ANUAL DA AGRICULTURA DES
- Page 88 and 89:
88MAÇÃSÍNTESE ANUAL DA AGRICULTU
- Page 90 and 91:
TABELA 2/I - MAÇÃ - ÁREA PLANTAD
- Page 92 and 93:
92MANDIOCASÍNTESE ANUAL DA AGRICUL
- Page 94 and 95:
94TABELA 2/I - FARINHA DE MANDIOCA
- Page 96 and 97:
TABELA 6/I - RAIZ DE MANDIOCA - ÁR
- Page 98 and 99:
98SÍNTESE ANUAL DA AGRICULTURA DES
- Page 100 and 101:
100SÍNTESE ANUAL DA AGRICULTURA DE
- Page 102 and 103:
SÍNTESE ANUAL DA AGRICULTURA DESAN
- Page 104 and 105:
104MILHOSÍNTESE ANUAL DA AGRICULTU
- Page 106 and 107:
106SÍNTESE ANUAL DA AGRICULTURA DE
- Page 108 and 109:
108SÍNTESE ANUAL DA AGRICULTURA DE
- Page 110 and 111:
110SÍNTESE ANUAL DA AGRICULTURA DE
- Page 112 and 113:
TABELA 6/I - MILHO - ÁREA PLANTADA
- Page 114 and 115:
114SOJASÍNTESE ANUAL DA AGRICULTUR
- Page 116 and 117:
116SÍNTESE ANUAL DA AGRICULTURA DE
- Page 118 and 119:
118SÍNTESE ANUAL DA AGRICULTURA DE
- Page 120 and 121:
TABELA 4/I - SOJA - ÁREA PLANTADA,
- Page 122 and 123:
122SÍNTESE ANUAL DA AGRICULTURA DE
- Page 124 and 125:
TABELA 3/I - TOMATE - ÁREA PLANTAD
- Page 126 and 127:
126SÍNTESE ANUAL DA AGRICULTURA DE
- Page 128 and 129:
128SÍNTESE ANUAL DA AGRICULTURA DE
- Page 130 and 131:
130SÍNTESE ANUAL DA AGRICULTURA DE
- Page 132 and 133:
132SÍNTESE ANUAL DA AGRICULTURA DE
- Page 134 and 135:
134SÍNTESE ANUAL DA AGRICULTURA DE
- Page 136 and 137:
136TABELA 9/I - TRIGO - QUANTIDADE
- Page 138 and 139:
138UVASÍNTESE ANUAL DA AGRICULTURA
- Page 140 and 141:
140SÍNTESE ANUAL DA AGRICULTURA DE
- Page 142 and 143:
142SÍNTESE ANUAL DA AGRICULTURA DE
- Page 144 and 145:
TABELA 1/I - NÚMERO DE MUNICÍPIOS
- Page 146 and 147:
146SÍNTESE ANUAL DA AGRICULTURA DE
- Page 148 and 149:
148SÍNTESE ANUAL DA AGRICULTURA DE
- Page 150 and 151:
TABELA 15/I - QUANTIDADE MÉDIA DE
- Page 152 and 153:
TABELA 18/I - PERFIL GERENCIAL DOS
- Page 154 and 155:
154SÍNTESE ANUAL DA AGRICULTURA DE
- Page 156 and 157:
156SÍNTESE ANUAL DA AGRICULTURA DE
- Page 158 and 159:
158SÍNTESE ANUAL DA AGRICULTURA DE
- Page 160 and 161:
160SÍNTESE ANUAL DA AGRICULTURA DE
- Page 162 and 163:
TABELA 25/I - PRODUÇÃO COMERCIALI
- Page 164 and 165:
TABELA 27/I - EXPORTAÇÕES CATARIN
- Page 166 and 167:
166SÍNTESE ANUAL DA AGRICULTURA DE
- Page 168 and 169:
168CALENDÁRIO AGRÍCOLACALENDÁRIO
- Page 170 and 171:
170DESEMPENHO DA PRODUÇÃO ANIMALS
- Page 172 and 173:
172SÍNTESE ANUAL DA AGRICULTURA DE
- Page 174 and 175:
174CARNE BOVINASÍNTESE ANUAL DA AG
- Page 176 and 177:
TABELA 2/I - CARNE BOVINA - OFERTA
- Page 178 and 179:
178CARNE SUÍNASÍNTESE ANUAL DA AG
- Page 180 and 181:
180SÍNTESE ANUAL DA AGRICULTURA DE
- Page 182 and 183:
182SÍNTESE ANUAL DA AGRICULTURA DE
- Page 184 and 185:
TABELA 11/I - SUÍNOS - ABATES TOTA
- Page 186 and 187:
186SÍNTESE ANUAL DA AGRICULTURA DE
- Page 188 and 189:
188SÍNTESE ANUAL DA AGRICULTURA DE
- Page 190 and 191:
190SÍNTESE ANUAL DA AGRICULTURA DE
- Page 192 and 193:
TABELA 4/I - LEITE - PRODUÇÃO DES
- Page 194 and 195:
194SÍNTESE ANUAL DA AGRICULTURA DE
- Page 196 and 197:
196SÍNTESE ANUAL DA AGRICULTURA DE
- Page 198 and 199:
198MELSÍNTESE ANUAL DA AGRICULTURA
- Page 200 and 201:
200SÍNTESE ANUAL DA AGRICULTURA DE
- Page 202 and 203: 202TABELA 4/I - MEL - PRODUÇÃO BR
- Page 204 and 205: TABELA 6/I - MEL - QUANTIDADE E VAL
- Page 206 and 207: TABELA 9/I - MEL - QUANTIDADE PRODU
- Page 208 and 209: 208OVOSSÍNTESE ANUAL DA AGRICULTUR
- Page 210 and 211: 210SÍNTESE ANUAL DA AGRICULTURA DE
- Page 212 and 213: produzidas na Região Sudeste, lide
- Page 214 and 215: TABELA 5/I - OVOS DE GALINHA - QUAN
- Page 216: 216SÍNTESE ANUAL DA AGRICULTURA DE
- Page 219 and 220: DESEMPENHO DA PESCA EAQÜICULTURA21
- Page 221 and 222: TABELA 2/I - PRODUÇÃO DA PESCA EX
- Page 223 and 224: TABELA 4/I - PREÇO DE PEIXES DESTI
- Page 225 and 226: TABELA 7/I - PREÇO DAS OSTRAS CULT
- Page 227 and 228: DESEMPENHO DO SETORFLORESTAL227SÍN
- Page 229 and 230: TABELA 1/I - PRODUÇÃO MUNDIAL DE
- Page 231 and 232: TABELA 3/I - PRODUÇÃO MUNDIAL DE
- Page 233 and 234: TABELA 6/I - VALOR DAS IMPORTAÇÕE
- Page 235 and 236: que mais se beneficiarão deste mer
- Page 237 and 238: TABELA 7/I - PRODUÇÃO DOS PRINCIP
- Page 239 and 240: perspectivas de expansão do setor
- Page 241 and 242: O valor da produção total da ind
- Page 243 and 244: Os EGP (edge glued panel - painel c
- Page 245 and 246: Desempenho da Indústriade Móveis
- Page 247 and 248: TABELA 12/I - PRODUÇÃO BRASILEIRA
- Page 249 and 250: Embora seja um dos estados com meno
- Page 251: 251Segundo a Fiesc, do consumo tota
- Page 255 and 256: 255SÍNTESE ANUAL DA AGRICULTURA DE
- Page 257 and 258: 257TABELA 16/I - EXPORTAÇÃO DE PR
- Page 259: Parte2
- Page 262 and 263: 262SÍNTESE ANUAL DA AGRICULTURA DE
- Page 264 and 265: 264SÍNTESE ANUAL DA AGRICULTURA DE
- Page 266 and 267: 266SÍNTESE ANUAL DA AGRICULTURA DE
- Page 268 and 269: 268 CARACTERIZAÇÃOSOCIOECONÔMICA
- Page 270 and 271: 270SÍNTESE ANUAL DA AGRICULTURA DE
- Page 272 and 273: 272SÍNTESE ANUAL DA AGRICULTURA DE
- Page 274 and 275: 274SÍNTESE ANUAL DA AGRICULTURA DE
- Page 276 and 277: 276continuaçãoMUNICÍPIOPOPULAÇ
- Page 278 and 279: 278SÍNTESE ANUAL DA AGRICULTURA DE
- Page 280 and 281: 280continuaçãoMICRORREGIÃO GEOGR
- Page 282 and 283: 282TABELA 18/II - CONSUMO APARENTE
- Page 284 and 285: 284 INFORMAÇÕESECONÔMICAS DAAGRO
- Page 286 and 287: continuação286PRODUTOS EXPORTADOS
- Page 288 and 289: 288continuaçãoPRODUTOS 1997 1998
- Page 290 and 291: continuaçãoANOMÊSARROZIRRIGADO(s
- Page 292 and 293: 292SÍNTESE ANUAL DA AGRICULTURA DE
- Page 294 and 295: 294SÍNTESE ANUAL DA AGRICULTURA DE
- Page 296 and 297: 296SÍNTESE ANUAL DA AGRICULTURA DE
- Page 298 and 299: 298SÍNTESE ANUAL DA AGRICULTURA DE
- Page 300 and 301: 300SÍNTESE ANUAL DA AGRICULTURA DE
- Page 303 and 304:
SECRETARIAS DE DESENVOLVIMENTOREGIO
- Page 305 and 306:
SÍNTESE ANUAL DA AGRICULTURA DESAN
- Page 307 and 308:
15ª SECRETARIA DE DESENVOLVIMENTO
- Page 309 and 310:
10ª SECRETARIA DE DESENVOLVIMENTO
- Page 311 and 312:
26ª SECRETARIA DE DESENVOLVIMENTO
- Page 313 and 314:
6ª SECRETARIA DE DESENVOLVIMENTO R
- Page 315 and 316:
11ª SECRETARIA DE DESENVOLVIMENTO
- Page 317 and 318:
17ª SECRETARIA DE DESENVOLVIMENTO
- Page 319 and 320:
24ª SECRETARIA DE DESENVOLVIMENTO
- Page 321 and 322:
23ª SECRETARIA DE DESENVOLVIMENTO
- Page 323 and 324:
19ª SECRETARIA DE DESENVOLVIMENTO
- Page 325 and 326:
2ª SECRETARIA DE DESENVOLVIMENTO R
- Page 327 and 328:
12ª SECRETARIA DE DESENVOLVIMENTO
- Page 329 and 330:
18ª SECRETARIA DE DESENVOLVIMENTO
- Page 331 and 332:
1ª SECRETARIA DE DESENVOLVIMENTO R
- Page 333 and 334:
9ª SECRETARIA DE DESENVOLVIMENTO R
- Page 335 and 336:
DIVISÃO TERRITORIAL DO ESTADO DESA
- Page 337 and 338:
continuaçãoMESORREGIÃO NORTE CAT
- Page 339 and 340:
continuaçãoJacinto MachadoMaracaj
- Page 341 and 342:
continuaçãocontinuaçãoSECRETARI
- Page 343 and 344:
continuaçãocontinuaçãoSECRETARI
- Page 345 and 346:
ASSOCIAÇÕES DE MUNCÍPIOS DOESTAD
- Page 347 and 348:
continuaçãoGrão ParáGravatalIma
- Page 349 and 350:
continuaçãoModeloPalmitosRiquezaR
- Page 351 and 352:
continuaçãoREGIÃO HIDROGRÁFICA
- Page 353 and 354:
continuaçãoREGIÃO HIDROGRÁFICA
- Page 355 and 356:
continuaçãoREGIÃO HIDROGRÁFICA
- Page 357 and 358:
continuaçãoREGIÃO HIDROGRÁFICA
- Page 359 and 360:
Pessoal ocupado - Pessoas que, em c
- Page 361 and 362:
362LISTA DE GRÁFICOSSÍNTESE ANUAL
- Page 363 and 364:
MEL1. Preços médios mensais receb
- Page 365 and 366:
366LISTA DE TABELASSÍNTESE ANUAL D
- Page 367 and 368:
Santa Catarina - Safra 02/03 ......
- Page 369 and 370:
5. Área colhida, produção e rend
- Page 371 and 372:
DESEMPENHO DA PRODUÇÃO ANIMAL372C
- Page 373 and 374:
374SÍNTESE ANUAL DA AGRICULTURA DE
- Page 375 and 376:
37630. Preços médios mensais rece
- Page 377:
378SÍNTESE ANUAL DA AGRICULTURA DE