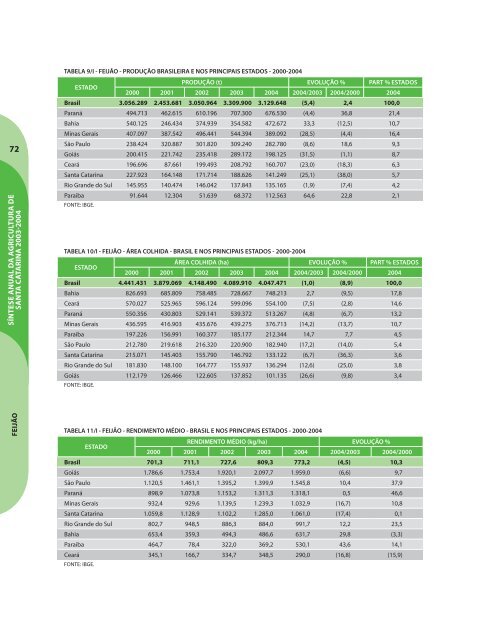
72SÍNTESE ANUAL DA AGRICULTURA DESANTA CATARINA <strong>2003</strong>-<strong>2004</strong>TABELA 9/I - FEIJÃO - PRODUÇÃO BRASILEIRA E NOS PRINCIPAIS ESTADOS - 2000-<strong>2004</strong>ESTADOPRODUÇÃO (t) EVOLUÇÃO % PART % ESTADOS2000 2001 2002 <strong>2003</strong> <strong>2004</strong> <strong>2004</strong>/<strong>2003</strong> <strong>2004</strong>/2000 <strong>2004</strong>Brasil 3.056.289 2.453.681 3.050.964 3.309.900 3.129.648 (5,4) 2,4 100,0Paraná 494.713 462.615 610.196 707.300 676.530 (4,4) 36,8 21,4Bahia 540.125 246.434 374.939 354.582 472.672 33,3 (12,5) 10,7Minas Gerais 407.097 387.542 496.441 544.394 389.092 (28,5) (4,4) 16,4São Paulo 238.424 320.887 301.820 309.240 282.780 (8,6) 18,6 9,3Goiás 200.415 221.742 235.418 289.172 198.125 (31,5) (1,1) 8,7Ceará 196.696 87.661 199.493 208.792 160.707 (23,0) (18,3) 6,3<strong>Santa</strong> <strong>Catarina</strong> 227.923 164.148 171.714 188.626 141.249 (25,1) (38,0) 5,7Rio Gran<strong>de</strong> do Sul 145.955 140.474 146.042 137.843 135.165 (1,9) (7,4) 4,2Paraiba 91.644 12.304 51.639 68.372 112.563 64,6 22,8 2,1FONTE: IBGE.TABELA 10/I - FEIJÃO - ÁREA COLHIDA - BRASIL E NOS PRINCIPAIS ESTADOS - 2000-<strong>2004</strong>ESTADOÁREA COLHIDA (ha) EVOLUÇÃO % PART % ESTADOS2000 2001 2002 <strong>2003</strong> <strong>2004</strong> <strong>2004</strong>/<strong>2003</strong> <strong>2004</strong>/2000 <strong>2004</strong>Brasil 4.441.431 3.879.069 4.148.490 4.089.910 4.047.471 (1,0) (8,9) 100,0Bahia 826.693 685.809 758.485 728.667 748.213 2,7 (9,5) 17,8Ceará 570.027 525.965 596.124 599.096 554.100 (7,5) (2,8) 14,6Paraná 550.356 430.803 529.141 539.372 513.267 (4,8) (6,7) 13,2Minas Gerais 436.595 416.903 435.676 439.275 376.713 (14,2) (13,7) 10,7Paraíba 197.226 156.991 160.377 185.177 212.344 14,7 7,7 4,5São Paulo 212.780 219.618 216.320 220.900 182.940 (17,2) (14,0) 5,4<strong>Santa</strong> <strong>Catarina</strong> 215.071 145.403 155.790 146.792 133.122 (6,7) (36,3) 3,6Rio Gran<strong>de</strong> do Sul 181.830 148.100 164.777 155.937 136.294 (12,6) (25,0) 3,8Goiás 112.179 126.466 122.605 137.852 101.135 (26,6) (9,8) 3,4FONTE: IBGE.FEIJÃOTABELA 11/I - FEIJÃO - RENDIMENTO MÉDIO - BRASIL E NOS PRINCIPAIS ESTADOS - 2000-<strong>2004</strong>ESTADORENDIMENTO MÉDIO (kg/ha) EVOLUÇÃO %2000 2001 2002 <strong>2003</strong> <strong>2004</strong> <strong>2004</strong>/<strong>2003</strong> <strong>2004</strong>/2000Brasil 701,3 711,1 727,6 809,3 773,2 (4,5) 10,3Goiás 1.786,6 1.753,4 1.920,1 2.097,7 1.959,0 (6,6) 9,7São Paulo 1.120,5 1.461,1 1.395,2 1.399,9 1.545,8 10,4 37,9Paraná 898,9 1.073,8 1.153,2 1.311,3 1.318,1 0,5 46,6Minas Gerais 932,4 929,6 1.139,5 1.239,3 1.032,9 (16,7) 10,8<strong>Santa</strong> <strong>Catarina</strong> 1.059,8 1.128,9 1.102,2 1.285,0 1.061,0 (17,4) 0,1Rio Gran<strong>de</strong> do Sul 802,7 948,5 886,3 884,0 991,7 12,2 23,5Bahia 653,4 359,3 494,3 486,6 631,7 29,8 (3,3)Paraíba 464,7 78,4 322,0 369,2 530,1 43,6 14,1Ceará 345,1 166,7 334,7 348,5 290,0 (16,8) (15,9)FONTE: IBGE.
Mesmo tendo sido planta<strong>da</strong> com atrasoem importantes regiões produtoras,em função do retardo <strong>da</strong> primeira safra,conseguiu níveis <strong>de</strong> produção 7% maioresdo que os <strong>da</strong> safrinha 02/03. Em relaçãoà <strong>de</strong> 2000, subiu 20%.Sua área cultiva<strong>da</strong> cresceu 6% nos doisúltimos anos e <strong>de</strong>clinou 5,5% nos últimoscinco anos.O rendimento médio vem evoluindo emdireção contrária; mesmo sem crescerno biênio, expandiu-se 25% no qüinqüênio.Com isso, passou a respon<strong>de</strong>r por 42%<strong>da</strong> produção nacional <strong>de</strong> feijão.A terceira safra nacional, ou <strong>de</strong> inverno,<strong>de</strong> longe a mais tecnifica<strong>da</strong>, <strong>de</strong>ve <strong>da</strong>ruma forte guina<strong>da</strong> em sua trajetória <strong>de</strong>crescimento.O outro, é a intensificação <strong>da</strong> substituiçãodo cultivo do feijão por outros cultivos,principalmente a soja, por seu comportamento“mais a<strong>de</strong>quado”, tanto nocampo (menor sensibili<strong>da</strong><strong>de</strong> às inconstânciasclimáticas), como no mercado(maior rentabili<strong>da</strong><strong>de</strong>).Dentre os principais estados produtores,a exploração econômica do feijão vemsofrendo refluxo generalizado.Se nos últimos dois anos cresceu apenasna Paraíba (65%) e na Bahia (33,5%),nos últimos cinco anos elevou-se expressivamenteno Paraná (37%), na Paraíba(22,5%) e em São Paulo (19%).No primeiro período acima, o <strong>de</strong>créscimo<strong>de</strong> produção foi particularmenteacentuado em Goiás (-31,5%), MinasGerais (-28,5%), <strong>Santa</strong> <strong>Catarina</strong> (-25%) eCeará (-23 %).73SÍNTESE ANUAL DA AGRICULTURA DESANTA CATARINA <strong>2003</strong>-<strong>2004</strong>Ao que tudo indica, sua produtivi<strong>da</strong><strong>de</strong><strong>de</strong>ve-se reduzir em 7%; sua área cultiva<strong>da</strong>,em -24% e sua produção; em-26,5%, se compara<strong>da</strong>s aos índices <strong>da</strong>terceira safra do ano passado.No segundo período, a produção recuoufortemente apenas em <strong>Santa</strong> <strong>Catarina</strong> (-38%), embora tenha sido expressiva noCeará (-18,5%), na Bahia (-12,5%) e noRio Gran<strong>de</strong> do Sul (-7,5%).A se confirmarem estas estimativas, osincrementos qüinqüenais dos índices terãosido vultosos: 16% em produtivi<strong>da</strong><strong>de</strong>,19% em área e 44% em produção(Tabelas 9, 10 e 11).Credita-se tamanha redução basicamenteao entrelaçamento <strong>de</strong> dois fatores.Só houve expansão <strong>de</strong> área planta<strong>da</strong> na Paraíba(15% no biênio, e 8% no qüinqüênio).Também no segundo período, os maioresrecuos <strong>de</strong> área aconteceram em <strong>Santa</strong><strong>Catarina</strong> (-36,5%) e Rio Gran<strong>de</strong> do Sul(-25%), sendo pouco significativa noCeará (-3%).FEIJÃOUm <strong>de</strong>les é a contração progressiva domercado nacional do produto em <strong>de</strong>corrência<strong>da</strong> redução dos níveis <strong>de</strong> consumo<strong>de</strong> feijão.Quanto ao rendimento médio <strong>da</strong> cultura,apenas o Ceará (-16%) teve que<strong>da</strong> expressivaem cinco anos.
- Page 1 and 2:
INSTITUTO DE PLANEJAMENTO E ECONOMI
- Page 3 and 4:
APRESENTAÇÃOSÍNTESE ANUAL DA AGR
- Page 5 and 6:
SUMÁRIOPARTE IDESEMPENHO DO AGRONE
- Page 7 and 8:
CONVENÇÕES= números entre parên
- Page 9:
Parte1
- Page 12 and 13:
12SÍNTESE ANUAL DA AGRICULTURA DES
- Page 14 and 15:
14SÍNTESE ANUAL DA AGRICULTURA DES
- Page 16 and 17:
16SÍNTESE ANUAL DA AGRICULTURA DES
- Page 18 and 19:
TABELA 2/I - VALOR BRUTO DA PRODUÇ
- Page 20 and 21:
20SÍNTESE ANUAL DA AGRICULTURA DES
- Page 22 and 23: 22SÍNTESE ANUAL DA AGRICULTURA DES
- Page 24 and 25: 24SÍNTESE ANUAL DA AGRICULTURA DES
- Page 26 and 27: TABELA 1/I - ALHO - ÁREA PLANTADA,
- Page 28 and 29: 28SÍNTESE ANUAL DA AGRICULTURA DES
- Page 30 and 31: 30SÍNTESE ANUAL DA AGRICULTURA DES
- Page 32 and 33: 32SÍNTESE ANUAL DA AGRICULTURA DES
- Page 34 and 35: TABELA 1/I - ARROZ - EVOLUÇÃO MUN
- Page 36 and 37: 36SÍNTESE ANUAL DA AGRICULTURA DES
- Page 38 and 39: 38TABELA 7/I - ARROZ - RENDIMENTO M
- Page 40 and 41: Outra, de maior repercussão, resul
- Page 42 and 43: 42SÍNTESE ANUAL DA AGRICULTURA DES
- Page 44 and 45: 44SÍNTESE ANUAL DA AGRICULTURA DES
- Page 46 and 47: TABELA 1/I - BANANA - EVOLUÇÃO NO
- Page 48 and 49: 48TABELA 4/I - FRUTAS - CONSUMO PER
- Page 50 and 51: 50SÍNTESE ANUAL DA AGRICULTURA DES
- Page 52 and 53: TABELA 9/I - BANANA - EVOLUÇÃO DO
- Page 54 and 55: 54SÍNTESE ANUAL DA AGRICULTURA DES
- Page 56 and 57: 56BATATASÍNTESE ANUAL DA AGRICULTU
- Page 58 and 59: TABELA 2/I - BATATA - EXPECTATIVA D
- Page 60 and 61: 60CEBOLASÍNTESE ANUAL DA AGRICULTU
- Page 62 and 63: 62SÍNTESE ANUAL DA AGRICULTURA DES
- Page 64 and 65: 64SÍNTESE ANUAL DA AGRICULTURA DES
- Page 66 and 67: 66TABELA 1/I - FEIJÕES SECOS - EVO
- Page 68 and 69: 68SÍNTESE ANUAL DA AGRICULTURA DES
- Page 70 and 71: 70SÍNTESE ANUAL DA AGRICULTURA DES
- Page 74 and 75: 74SÍNTESE ANUAL DA AGRICULTURA DES
- Page 76 and 77: 76SÍNTESE ANUAL DA AGRICULTURA DES
- Page 78 and 79: plantio da safrinha, que, por sua v
- Page 80 and 81: 80FUMOSÍNTESE ANUAL DA AGRICULTURA
- Page 82 and 83: 82SÍNTESE ANUAL DA AGRICULTURA DES
- Page 84 and 85: 84SÍNTESE ANUAL DA AGRICULTURA DES
- Page 86 and 87: 86SÍNTESE ANUAL DA AGRICULTURA DES
- Page 88 and 89: 88MAÇÃSÍNTESE ANUAL DA AGRICULTU
- Page 90 and 91: TABELA 2/I - MAÇÃ - ÁREA PLANTAD
- Page 92 and 93: 92MANDIOCASÍNTESE ANUAL DA AGRICUL
- Page 94 and 95: 94TABELA 2/I - FARINHA DE MANDIOCA
- Page 96 and 97: TABELA 6/I - RAIZ DE MANDIOCA - ÁR
- Page 98 and 99: 98SÍNTESE ANUAL DA AGRICULTURA DES
- Page 100 and 101: 100SÍNTESE ANUAL DA AGRICULTURA DE
- Page 102 and 103: SÍNTESE ANUAL DA AGRICULTURA DESAN
- Page 104 and 105: 104MILHOSÍNTESE ANUAL DA AGRICULTU
- Page 106 and 107: 106SÍNTESE ANUAL DA AGRICULTURA DE
- Page 108 and 109: 108SÍNTESE ANUAL DA AGRICULTURA DE
- Page 110 and 111: 110SÍNTESE ANUAL DA AGRICULTURA DE
- Page 112 and 113: TABELA 6/I - MILHO - ÁREA PLANTADA
- Page 114 and 115: 114SOJASÍNTESE ANUAL DA AGRICULTUR
- Page 116 and 117: 116SÍNTESE ANUAL DA AGRICULTURA DE
- Page 118 and 119: 118SÍNTESE ANUAL DA AGRICULTURA DE
- Page 120 and 121: TABELA 4/I - SOJA - ÁREA PLANTADA,
- Page 122 and 123:
122SÍNTESE ANUAL DA AGRICULTURA DE
- Page 124 and 125:
TABELA 3/I - TOMATE - ÁREA PLANTAD
- Page 126 and 127:
126SÍNTESE ANUAL DA AGRICULTURA DE
- Page 128 and 129:
128SÍNTESE ANUAL DA AGRICULTURA DE
- Page 130 and 131:
130SÍNTESE ANUAL DA AGRICULTURA DE
- Page 132 and 133:
132SÍNTESE ANUAL DA AGRICULTURA DE
- Page 134 and 135:
134SÍNTESE ANUAL DA AGRICULTURA DE
- Page 136 and 137:
136TABELA 9/I - TRIGO - QUANTIDADE
- Page 138 and 139:
138UVASÍNTESE ANUAL DA AGRICULTURA
- Page 140 and 141:
140SÍNTESE ANUAL DA AGRICULTURA DE
- Page 142 and 143:
142SÍNTESE ANUAL DA AGRICULTURA DE
- Page 144 and 145:
TABELA 1/I - NÚMERO DE MUNICÍPIOS
- Page 146 and 147:
146SÍNTESE ANUAL DA AGRICULTURA DE
- Page 148 and 149:
148SÍNTESE ANUAL DA AGRICULTURA DE
- Page 150 and 151:
TABELA 15/I - QUANTIDADE MÉDIA DE
- Page 152 and 153:
TABELA 18/I - PERFIL GERENCIAL DOS
- Page 154 and 155:
154SÍNTESE ANUAL DA AGRICULTURA DE
- Page 156 and 157:
156SÍNTESE ANUAL DA AGRICULTURA DE
- Page 158 and 159:
158SÍNTESE ANUAL DA AGRICULTURA DE
- Page 160 and 161:
160SÍNTESE ANUAL DA AGRICULTURA DE
- Page 162 and 163:
TABELA 25/I - PRODUÇÃO COMERCIALI
- Page 164 and 165:
TABELA 27/I - EXPORTAÇÕES CATARIN
- Page 166 and 167:
166SÍNTESE ANUAL DA AGRICULTURA DE
- Page 168 and 169:
168CALENDÁRIO AGRÍCOLACALENDÁRIO
- Page 170 and 171:
170DESEMPENHO DA PRODUÇÃO ANIMALS
- Page 172 and 173:
172SÍNTESE ANUAL DA AGRICULTURA DE
- Page 174 and 175:
174CARNE BOVINASÍNTESE ANUAL DA AG
- Page 176 and 177:
TABELA 2/I - CARNE BOVINA - OFERTA
- Page 178 and 179:
178CARNE SUÍNASÍNTESE ANUAL DA AG
- Page 180 and 181:
180SÍNTESE ANUAL DA AGRICULTURA DE
- Page 182 and 183:
182SÍNTESE ANUAL DA AGRICULTURA DE
- Page 184 and 185:
TABELA 11/I - SUÍNOS - ABATES TOTA
- Page 186 and 187:
186SÍNTESE ANUAL DA AGRICULTURA DE
- Page 188 and 189:
188SÍNTESE ANUAL DA AGRICULTURA DE
- Page 190 and 191:
190SÍNTESE ANUAL DA AGRICULTURA DE
- Page 192 and 193:
TABELA 4/I - LEITE - PRODUÇÃO DES
- Page 194 and 195:
194SÍNTESE ANUAL DA AGRICULTURA DE
- Page 196 and 197:
196SÍNTESE ANUAL DA AGRICULTURA DE
- Page 198 and 199:
198MELSÍNTESE ANUAL DA AGRICULTURA
- Page 200 and 201:
200SÍNTESE ANUAL DA AGRICULTURA DE
- Page 202 and 203:
202TABELA 4/I - MEL - PRODUÇÃO BR
- Page 204 and 205:
TABELA 6/I - MEL - QUANTIDADE E VAL
- Page 206 and 207:
TABELA 9/I - MEL - QUANTIDADE PRODU
- Page 208 and 209:
208OVOSSÍNTESE ANUAL DA AGRICULTUR
- Page 210 and 211:
210SÍNTESE ANUAL DA AGRICULTURA DE
- Page 212 and 213:
produzidas na Região Sudeste, lide
- Page 214 and 215:
TABELA 5/I - OVOS DE GALINHA - QUAN
- Page 216:
216SÍNTESE ANUAL DA AGRICULTURA DE
- Page 219 and 220:
DESEMPENHO DA PESCA EAQÜICULTURA21
- Page 221 and 222:
TABELA 2/I - PRODUÇÃO DA PESCA EX
- Page 223 and 224:
TABELA 4/I - PREÇO DE PEIXES DESTI
- Page 225 and 226:
TABELA 7/I - PREÇO DAS OSTRAS CULT
- Page 227 and 228:
DESEMPENHO DO SETORFLORESTAL227SÍN
- Page 229 and 230:
TABELA 1/I - PRODUÇÃO MUNDIAL DE
- Page 231 and 232:
TABELA 3/I - PRODUÇÃO MUNDIAL DE
- Page 233 and 234:
TABELA 6/I - VALOR DAS IMPORTAÇÕE
- Page 235 and 236:
que mais se beneficiarão deste mer
- Page 237 and 238:
TABELA 7/I - PRODUÇÃO DOS PRINCIP
- Page 239 and 240:
perspectivas de expansão do setor
- Page 241 and 242:
O valor da produção total da ind
- Page 243 and 244:
Os EGP (edge glued panel - painel c
- Page 245 and 246:
Desempenho da Indústriade Móveis
- Page 247 and 248:
TABELA 12/I - PRODUÇÃO BRASILEIRA
- Page 249 and 250:
Embora seja um dos estados com meno
- Page 251 and 252:
251Segundo a Fiesc, do consumo tota
- Page 253 and 254:
Preços dos Insumos eProdutos Flore
- Page 255 and 256:
255SÍNTESE ANUAL DA AGRICULTURA DE
- Page 257 and 258:
257TABELA 16/I - EXPORTAÇÃO DE PR
- Page 259:
Parte2
- Page 262 and 263:
262SÍNTESE ANUAL DA AGRICULTURA DE
- Page 264 and 265:
264SÍNTESE ANUAL DA AGRICULTURA DE
- Page 266 and 267:
266SÍNTESE ANUAL DA AGRICULTURA DE
- Page 268 and 269:
268 CARACTERIZAÇÃOSOCIOECONÔMICA
- Page 270 and 271:
270SÍNTESE ANUAL DA AGRICULTURA DE
- Page 272 and 273:
272SÍNTESE ANUAL DA AGRICULTURA DE
- Page 274 and 275:
274SÍNTESE ANUAL DA AGRICULTURA DE
- Page 276 and 277:
276continuaçãoMUNICÍPIOPOPULAÇ
- Page 278 and 279:
278SÍNTESE ANUAL DA AGRICULTURA DE
- Page 280 and 281:
280continuaçãoMICRORREGIÃO GEOGR
- Page 282 and 283:
282TABELA 18/II - CONSUMO APARENTE
- Page 284 and 285:
284 INFORMAÇÕESECONÔMICAS DAAGRO
- Page 286 and 287:
continuação286PRODUTOS EXPORTADOS
- Page 288 and 289:
288continuaçãoPRODUTOS 1997 1998
- Page 290 and 291:
continuaçãoANOMÊSARROZIRRIGADO(s
- Page 292 and 293:
292SÍNTESE ANUAL DA AGRICULTURA DE
- Page 294 and 295:
294SÍNTESE ANUAL DA AGRICULTURA DE
- Page 296 and 297:
296SÍNTESE ANUAL DA AGRICULTURA DE
- Page 298 and 299:
298SÍNTESE ANUAL DA AGRICULTURA DE
- Page 300 and 301:
300SÍNTESE ANUAL DA AGRICULTURA DE
- Page 303 and 304:
SECRETARIAS DE DESENVOLVIMENTOREGIO
- Page 305 and 306:
SÍNTESE ANUAL DA AGRICULTURA DESAN
- Page 307 and 308:
15ª SECRETARIA DE DESENVOLVIMENTO
- Page 309 and 310:
10ª SECRETARIA DE DESENVOLVIMENTO
- Page 311 and 312:
26ª SECRETARIA DE DESENVOLVIMENTO
- Page 313 and 314:
6ª SECRETARIA DE DESENVOLVIMENTO R
- Page 315 and 316:
11ª SECRETARIA DE DESENVOLVIMENTO
- Page 317 and 318:
17ª SECRETARIA DE DESENVOLVIMENTO
- Page 319 and 320:
24ª SECRETARIA DE DESENVOLVIMENTO
- Page 321 and 322:
23ª SECRETARIA DE DESENVOLVIMENTO
- Page 323 and 324:
19ª SECRETARIA DE DESENVOLVIMENTO
- Page 325 and 326:
2ª SECRETARIA DE DESENVOLVIMENTO R
- Page 327 and 328:
12ª SECRETARIA DE DESENVOLVIMENTO
- Page 329 and 330:
18ª SECRETARIA DE DESENVOLVIMENTO
- Page 331 and 332:
1ª SECRETARIA DE DESENVOLVIMENTO R
- Page 333 and 334:
9ª SECRETARIA DE DESENVOLVIMENTO R
- Page 335 and 336:
DIVISÃO TERRITORIAL DO ESTADO DESA
- Page 337 and 338:
continuaçãoMESORREGIÃO NORTE CAT
- Page 339 and 340:
continuaçãoJacinto MachadoMaracaj
- Page 341 and 342:
continuaçãocontinuaçãoSECRETARI
- Page 343 and 344:
continuaçãocontinuaçãoSECRETARI
- Page 345 and 346:
ASSOCIAÇÕES DE MUNCÍPIOS DOESTAD
- Page 347 and 348:
continuaçãoGrão ParáGravatalIma
- Page 349 and 350:
continuaçãoModeloPalmitosRiquezaR
- Page 351 and 352:
continuaçãoREGIÃO HIDROGRÁFICA
- Page 353 and 354:
continuaçãoREGIÃO HIDROGRÁFICA
- Page 355 and 356:
continuaçãoREGIÃO HIDROGRÁFICA
- Page 357 and 358:
continuaçãoREGIÃO HIDROGRÁFICA
- Page 359 and 360:
Pessoal ocupado - Pessoas que, em c
- Page 361 and 362:
362LISTA DE GRÁFICOSSÍNTESE ANUAL
- Page 363 and 364:
MEL1. Preços médios mensais receb
- Page 365 and 366:
366LISTA DE TABELASSÍNTESE ANUAL D
- Page 367 and 368:
Santa Catarina - Safra 02/03 ......
- Page 369 and 370:
5. Área colhida, produção e rend
- Page 371 and 372:
DESEMPENHO DA PRODUÇÃO ANIMAL372C
- Page 373 and 374:
374SÍNTESE ANUAL DA AGRICULTURA DE
- Page 375 and 376:
37630. Preços médios mensais rece
- Page 377:
378SÍNTESE ANUAL DA AGRICULTURA DE