

Kerala 2005 - of Planning Commission
Kerala 2005 - of Planning Commission
Kerala 2005 - of Planning Commission

Create successful ePaper yourself
Turn your PDF publications into a flip-book with our unique Google optimized e-Paper software.
102<br />
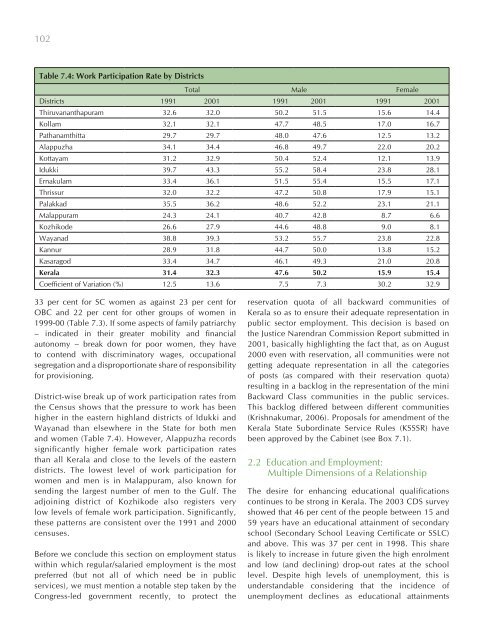
Table 7.4: Work Participation Rate by Districts<br />
Total Male Female<br />
Districts 1991 2001 1991 2001 1991 2001<br />
Thiruvananthapuram 32.6 32.0 50.2 51.5 15.6 14.4<br />
Kollam 32.1 32.1 47.7 48.5 17.0 16.7<br />
Pathanamthitta 29.7 29.7 48.0 47.6 12.5 13.2<br />
Alappuzha 34.1 34.4 46.8 49.7 22.0 20.2<br />
Kottayam 31.2 32.9 50.4 52.4 12.1 13.9<br />
Idukki 39.7 43.3 55.2 58.4 23.8 28.1<br />
Ernakulam 33.4 36.1 51.5 55.4 15.5 17.1<br />
Thrissur 32.0 32.2 47.2 50.8 17.9 15.1<br />
Palakkad 35.5 36.2 48.6 52.2 23.1 21.1<br />
Malappuram 24.3 24.1 40.7 42.8 8.7 6.6<br />
Kozhikode 26.6 27.9 44.6 48.8 9.0 8.1<br />
Wayanad 38.8 39.3 53.2 55.7 23.8 22.8<br />
Kannur 28.9 31.8 44.7 50.0 13.8 15.2<br />
Kasaragod 33.4 34.7 46.1 49.3 21.0 20.8<br />
<strong>Kerala</strong> 31.4 32.3 47.6 50.2 15.9 15.4<br />
Coefficient <strong>of</strong> Variation (%) 12.5 13.6 7.5 7.3 30.2 32.9<br />
33 per cent for SC women as against 23 per cent for<br />
OBC and 22 per cent for other groups <strong>of</strong> women in<br />
1999-00 (Table 7.3). If some aspects <strong>of</strong> family patriarchy<br />
– indicated in their greater mobility and financial<br />
autonomy – break down for poor women, they have<br />
to contend with discriminatory wages, occupational<br />
segregation and a disproportionate share <strong>of</strong> responsibility<br />
for provisioning.<br />
District-wise break up <strong>of</strong> work participation rates from<br />
the Census shows that the pressure to work has been<br />
higher in the eastern highland districts <strong>of</strong> Idukki and<br />
Wayanad than elsewhere in the State for both men<br />
and women (Table 7.4). However, Alappuzha records<br />
significantly higher female work participation rates<br />
than all <strong>Kerala</strong> and close to the levels <strong>of</strong> the eastern<br />
districts. The lowest level <strong>of</strong> work participation for<br />
women and men is in Malappuram, also known for<br />
sending the largest number <strong>of</strong> men to the Gulf. The<br />
adjoining district <strong>of</strong> Kozhikode also registers very<br />
low levels <strong>of</strong> female work participation. Significantly,<br />
these patterns are consistent over the 1991 and 2000<br />
censuses.<br />
Before we conclude this section on employment status<br />
within which regular/salaried employment is the most<br />
preferred (but not all <strong>of</strong> which need be in public<br />
services), we must mention a notable step taken by the<br />
Congress-led government recently, to protect the<br />
reservation quota <strong>of</strong> all backward communities <strong>of</strong><br />
<strong>Kerala</strong> so as to ensure their adequate representation in<br />
public sector employment. This decision is based on<br />
the Justice Narendran <strong>Commission</strong> Report submitted in<br />
2001, basically highlighting the fact that, as on August<br />
2000 even with reservation, all communities were not<br />
getting adequate representation in all the categories<br />
<strong>of</strong> posts (as compared with their reservation quota)<br />
resulting in a backlog in the representation <strong>of</strong> the mini<br />
Backward Class communities in the public services.<br />
This backlog differed between different communities<br />
(Krishnakumar, 2006). Proposals for amendment <strong>of</strong> the<br />
<strong>Kerala</strong> State Subordinate Service Rules (KSSSR) have<br />
been approved by the Cabinet (see Box 7.1).<br />
2.2 Education and Employment:<br />
Multiple Dimensions <strong>of</strong> a Relationship<br />
The desire for enhancing educational qualifications<br />
continues to be strong in <strong>Kerala</strong>. The 2003 CDS survey<br />
showed that 46 per cent <strong>of</strong> the people between 15 and<br />
59 years have an educational attainment <strong>of</strong> secondary<br />
school (Secondary School Leaving Certificate or SSLC)<br />
and above. This was 37 per cent in 1998. This share<br />
is likely to increase in future given the high enrolment<br />
and low (and declining) drop-out rates at the school<br />
level. Despite high levels <strong>of</strong> unemployment, this is<br />
understandable considering that the incidence <strong>of</strong><br />
unemployment declines as educational attainments


