

Kerala 2005 - of Planning Commission
Kerala 2005 - of Planning Commission
Kerala 2005 - of Planning Commission

You also want an ePaper? Increase the reach of your titles
YUMPU automatically turns print PDFs into web optimized ePapers that Google loves.
TECHNICAL NOTE<br />
169<br />
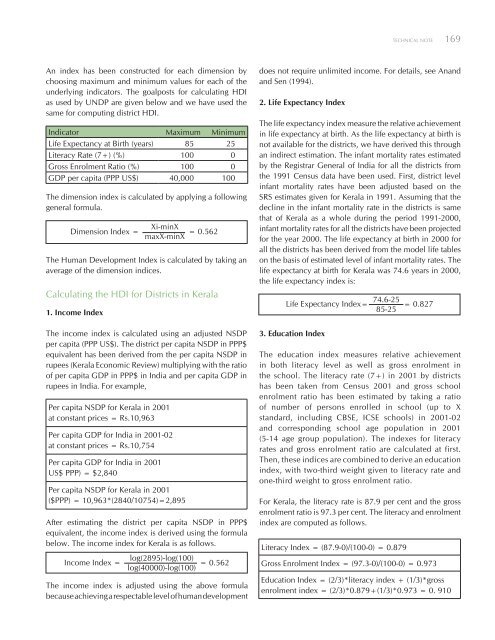
An index has been constructed for each dimension by<br />
choosing maximum and minimum values for each <strong>of</strong> the<br />
underlying indicators. The goalposts for calculating HDI<br />
as used by UNDP are given below and we have used the<br />
same for computing district HDI.<br />
Indicator Maximum Minimum<br />
Life Expectancy at Birth (years) 85 25<br />
Literacy Rate (7+) (%) 100 0<br />
Gross Enrolment Ratio (%) 100 0<br />
GDP per capita (PPP US$) 40,000 100<br />
The dimension index is calculated by applying a following<br />
general formula.<br />
Dimension Index =<br />
The Human Development Index is calculated by taking an<br />
average <strong>of</strong> the dimension indices.<br />
Calculating the HDI for Districts in <strong>Kerala</strong><br />
1. Income Index<br />
Xi-minX<br />
maxX-minX = 0.562<br />
does not require unlimited income. For details, see Anand<br />
and Sen (1994).<br />
2. Life Expectancy Index<br />
The life expectancy index measure the relative achievement<br />
in life expectancy at birth. As the life expectancy at birth is<br />
not available for the districts, we have derived this through<br />
an indirect estimation. The infant mortality rates estimated<br />
by the Registrar General <strong>of</strong> India for all the districts from<br />
the 1991 Census data have been used. First, district level<br />
infant mortality rates have been adjusted based on the<br />
SRS estimates given for <strong>Kerala</strong> in 1991. Assuming that the<br />
decline in the infant mortality rate in the districts is same<br />
that <strong>of</strong> <strong>Kerala</strong> as a whole during the period 1991-2000,<br />
infant mortality rates for all the districts have been projected<br />
for the year 2000. The life expectancy at birth in 2000 for<br />
all the districts has been derived from the model life tables<br />
on the basis <strong>of</strong> estimated level <strong>of</strong> infant mortality rates. The<br />
life expectancy at birth for <strong>Kerala</strong> was 74.6 years in 2000,<br />
the life expectancy index is:<br />
74.6-25<br />
Life Expectancy Index= = 0.827<br />
85-25<br />
The income index is calculated using an adjusted NSDP<br />
per capita (PPP US$). The district per capita NSDP in PPP$<br />
equivalent has been derived from the per capita NSDP in<br />
rupees (<strong>Kerala</strong> Economic Review) multiplying with the ratio<br />
<strong>of</strong> per capita GDP in PPP$ in India and per capita GDP in<br />
rupees in India. For example,<br />
Per capita NSDP for <strong>Kerala</strong> in 2001<br />
at constant prices = Rs.10,963<br />
Per capita GDP for India in 2001-02<br />
at constant prices = Rs.10,754<br />
Per capita GDP for India in 2001<br />
US$ PPP) = $2,840<br />
Per capita NSDP for <strong>Kerala</strong> in 2001<br />
($PPP) = 10,963*(2840/10754)=2,895<br />
After estimating the district per capita NSDP in PPP$<br />
equivalent, the income index is derived using the formula<br />
below. The income index for <strong>Kerala</strong> is as follows.<br />
Income Index =<br />
3. Education Index<br />
The education index measures relative achievement<br />
in both literacy level as well as gross enrolment in<br />
the school. The literacy rate (7+) in 2001 by districts<br />
has been taken from Census 2001 and gross school<br />
enrolment ratio has been estimated by taking a ratio<br />
<strong>of</strong> number <strong>of</strong> persons enrolled in school (up to X<br />
standard, including CBSE, ICSE schools) in 2001-02<br />
and corresponding school age population in 2001<br />
(5-14 age group population). The indexes for literacy<br />
rates and gross enrolment ratio are calculated at first.<br />
Then, these indices are combined to derive an education<br />
index, with two-third weight given to literacy rate and<br />
one-third weight to gross enrolment ratio.<br />
For <strong>Kerala</strong>, the literacy rate is 87.9 per cent and the gross<br />
enrolment ratio is 97.3 per cent. The literacy and enrolment<br />
index are computed as follows.<br />
Literacy Index = (87.9-0)/(100-0) = 0.879<br />
log(2895)-log(100)<br />
log(40000)-log(100) = 0.562 Gross Enrolment Index = (97.3-0)/(100-0) = 0.973<br />
The income index is adjusted using the above formula<br />
because achieving a respectable level <strong>of</strong> human development<br />
Education Index = (2/3)*literacy index + (1/3)*gross<br />
enrolment index = (2/3)*0.879+(1/3)*0.973 = 0. 910


