

Kerala 2005 - of Planning Commission
Kerala 2005 - of Planning Commission
Kerala 2005 - of Planning Commission

Create successful ePaper yourself
Turn your PDF publications into a flip-book with our unique Google optimized e-Paper software.
DISTRICT PROFILES<br />
187<br />
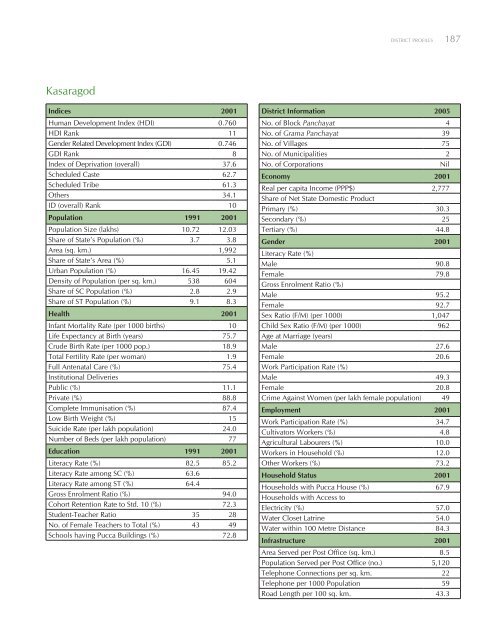
Kasaragod<br />
Indices 2001<br />
Human Development Index (HDI) 0.760<br />
HDI Rank 11<br />
Gender Related Development Index (GDI) 0.746<br />
GDI Rank 8<br />
Index <strong>of</strong> Deprivation (overall) 37.6<br />
Scheduled Caste 62.7<br />
Scheduled Tribe 61.3<br />
Others 34.1<br />
ID (overall) Rank 10<br />
Population 1991 2001<br />
Population Size (lakhs) 10.72 12.03<br />
Share <strong>of</strong> State’s Population (%) 3.7 3.8<br />
Area (sq. km.) 1,992<br />
Share <strong>of</strong> State’s Area (%) 5.1<br />
Urban Population (%) 16.45 19.42<br />
Density <strong>of</strong> Population (per sq. km.) 538 604<br />
Share <strong>of</strong> SC Population (%) 2.8 2.9<br />
Share <strong>of</strong> ST Population (%) 9.1 8.3<br />
Health 2001<br />
Infant Mortality Rate (per 1000 births) 10<br />
Life Expectancy at Birth (years) 75.7<br />
Crude Birth Rate (per 1000 pop.) 18.9<br />
Total Fertility Rate (per woman) 1.9<br />
Full Antenatal Care (%) 75.4<br />
Institutional Deliveries<br />
Public (%) 11.1<br />
Private (%) 88.8<br />
Complete Immunisation (%) 87.4<br />
Low Birth Weight (%) 15<br />
Suicide Rate (per lakh population) 24.0<br />
Number <strong>of</strong> Beds (per lakh population) 77<br />
Education 1991 2001<br />
Literacy Rate (%) 82.5 85.2<br />
Literacy Rate among SC (%) 63.6<br />
Literacy Rate among ST (%) 64.4<br />
Gross Enrolment Ratio (%) 94.0<br />
Cohort Retention Rate to Std. 10 (%) 72.3<br />
Student-Teacher Ratio 35 28<br />
No. <strong>of</strong> Female Teachers to Total (%) 43 49<br />
Schools having Pucca Buildings (%) 72.8<br />
District Information <strong>2005</strong><br />
No. <strong>of</strong> Block Panchayat 4<br />
No. <strong>of</strong> Grama Panchayat 39<br />
No. <strong>of</strong> Villages 75<br />
No. <strong>of</strong> Municipalities 2<br />
No. <strong>of</strong> Corporations<br />
Nil<br />
Economy 2001<br />
Real per capita Income (PPP$) 2,777<br />
Share <strong>of</strong> Net State Domestic Product<br />
Primary (%) 30.3<br />
Secondary (%) 25<br />
Tertiary (%) 44.8<br />
Gender 2001<br />
Literacy Rate (%)<br />
Male 90.8<br />
Female 79.8<br />
Gross Enrolment Ratio (%)<br />
Male 95.2<br />
Female 92.7<br />
Sex Ratio (F/M) (per 1000) 1,047<br />
Child Sex Ratio (F/M) (per 1000) 962<br />
Age at Marriage (years)<br />
Male 27.6<br />
Female 20.6<br />
Work Participation Rate (%)<br />
Male 49.3<br />
Female 20.8<br />
Crime Against Women (per lakh female population) 49<br />
Employment 2001<br />
Work Participation Rate (%) 34.7<br />
Cultivators Workers (%) 4.8<br />
Agricultural Labourers (%) 10.0<br />
Workers in Household (%) 12.0<br />
Other Workers (%) 73.2<br />
Household Status 2001<br />
Households with Pucca House (%) 67.9<br />
Households with Access to<br />
Electricity (%) 57.0<br />
Water Closet Latrine 54.0<br />
Water within 100 Metre Distance 84.3<br />
Infrastructure 2001<br />
Area Served per Post Office (sq. km.) 8.5<br />
Population Served per Post Office (no.) 5,120<br />
Telephone Connections per sq. km. 22<br />
Telephone per 1000 Population 59<br />
Road Length per 100 sq. km. 43.3


