

Kerala 2005 - of Planning Commission
Kerala 2005 - of Planning Commission
Kerala 2005 - of Planning Commission

You also want an ePaper? Increase the reach of your titles
YUMPU automatically turns print PDFs into web optimized ePapers that Google loves.
168<br />
Technical Note<br />
HUMAN DEVELOPMENT INDEX, GENDER DEVELOPMENT INDEX<br />
AND INDEX OF DEPRIVATION<br />
A. Human Development Index For Districts In <strong>Kerala</strong><br />
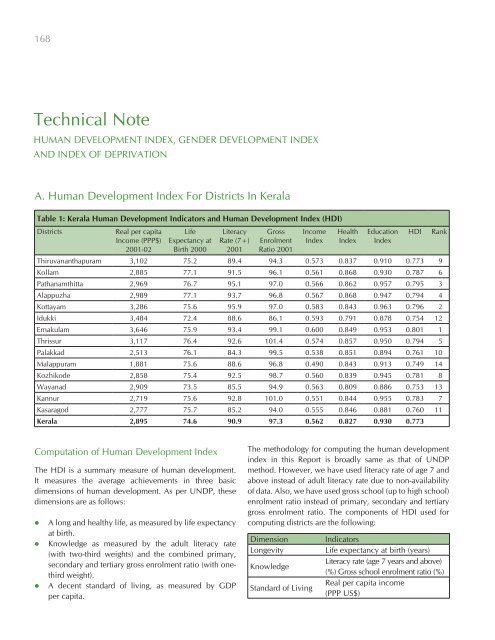
Table 1: <strong>Kerala</strong> Human Development Indicators and Human Development Index (HDI)<br />
Districts<br />
Real per capita<br />
Income (PPP$)<br />
2001-02<br />
Life<br />
Expectancy at<br />
Birth 2000<br />
Literacy<br />
Rate (7+)<br />
2001<br />
Gross<br />
Enrolment<br />
Ratio 2001<br />
Income<br />
Index<br />
Health<br />
Index<br />
Education<br />
Index<br />
Thiruvananthapuram 3,102 75.2 89.4 94.3 0.573 0.837 0.910 0.773 9<br />
Kollam 2,885 77.1 91.5 96.1 0.561 0.868 0.930 0.787 6<br />
Pathanamthitta 2,969 76.7 95.1 97.0 0.566 0.862 0.957 0.795 3<br />
Alappuzha 2,989 77.1 93.7 96.8 0.567 0.868 0.947 0.794 4<br />
Kottayam 3,286 75.6 95.9 97.0 0.583 0.843 0.963 0.796 2<br />
Idukki 3,484 72.4 88.6 86.1 0.593 0.791 0.878 0.754 12<br />
Ernakulam 3,646 75.9 93.4 99.1 0.600 0.849 0.953 0.801 1<br />
Thrissur 3,117 76.4 92.6 101.4 0.574 0.857 0.950 0.794 5<br />
Palakkad 2,513 76.1 84.3 99.5 0.538 0.851 0.894 0.761 10<br />
Malappuram 1,881 75.6 88.6 96.8 0.490 0.843 0.913 0.749 14<br />
Kozhikode 2,858 75.4 92.5 98.7 0.560 0.839 0.945 0.781 8<br />
Wayanad 2,909 73.5 85.5 94.9 0.563 0.809 0.886 0.753 13<br />
Kannur 2,719 75.6 92.8 101.0 0.551 0.844 0.955 0.783 7<br />
Kasaragod 2,777 75.7 85.2 94.0 0.555 0.846 0.881 0.760 11<br />
<strong>Kerala</strong> 2,895 74.6 90.9 97.3 0.562 0.827 0.930 0.773<br />
HDI<br />
Rank<br />
Computation <strong>of</strong> Human Development Index<br />
The HDI is a summary measure <strong>of</strong> human development.<br />
It measures the average achievements in three basic<br />
dimensions <strong>of</strong> human development. As per UNDP, these<br />
dimensions are as follows:<br />
• A long and healthy life, as measured by life expectancy<br />
at birth.<br />
• Knowledge as measured by the adult literacy rate<br />
(with two-third weights) and the combined primary,<br />
secondary and tertiary gross enrolment ratio (with onethird<br />
weight).<br />
• A decent standard <strong>of</strong> living, as measured by GDP<br />
per capita.<br />
The methodology for computing the human development<br />
index in this Report is broadly same as that <strong>of</strong> UNDP<br />
method. However, we have used literacy rate <strong>of</strong> age 7 and<br />
above instead <strong>of</strong> adult literacy rate due to non-availability<br />
<strong>of</strong> data. Also, we have used gross school (up to high school)<br />
enrolment ratio instead <strong>of</strong> primary, secondary and tertiary<br />
gross enrolment ratio. The components <strong>of</strong> HDI used for<br />
computing districts are the following:<br />
Dimension<br />
Longevity<br />
Knowledge<br />
Standard <strong>of</strong> Living<br />
Indicators<br />
Life expectancy at birth (years)<br />
Literacy rate (age 7 years and above)<br />
(%) Gross school enrolment ratio (%)<br />
Real per capita income<br />
(PPP US$)


