

Kerala 2005 - of Planning Commission
Kerala 2005 - of Planning Commission
Kerala 2005 - of Planning Commission

You also want an ePaper? Increase the reach of your titles
YUMPU automatically turns print PDFs into web optimized ePapers that Google loves.
CHAPTER 2<br />
ASSESSING DEVELOPMENT: SOME NON- INCOME DIMENSIONS<br />
37<br />
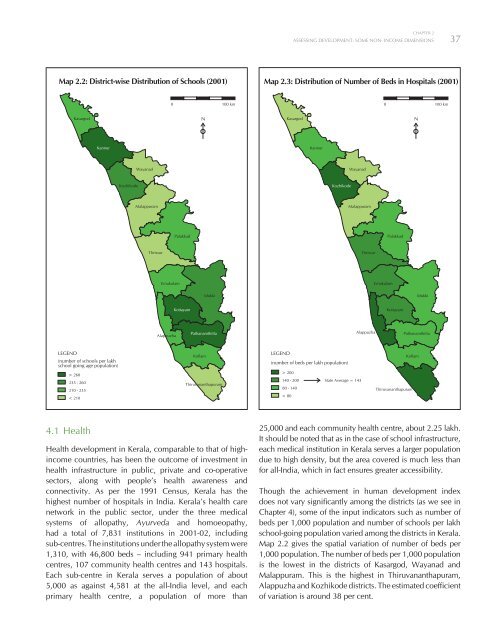
Map 2.2: District-wise Distribution <strong>of</strong> Schools (2001)<br />
Map 2.3: Distribution <strong>of</strong> Number <strong>of</strong> Beds in Hospitals (2001)<br />
4.1 Health<br />
Health development in <strong>Kerala</strong>, comparable to that <strong>of</strong> highincome<br />
countries, has been the outcome <strong>of</strong> investment in<br />
health infrastructure in public, private and co-operative<br />
sectors, along with people’s health awareness and<br />
connectivity. As per the 1991 Census, <strong>Kerala</strong> has the<br />
highest number <strong>of</strong> hospitals in India. <strong>Kerala</strong>’s health care<br />
network in the public sector, under the three medical<br />
systems <strong>of</strong> allopathy, Ayurveda and homoeopathy,<br />
had a total <strong>of</strong> 7,831 institutions in 2001-02, including<br />
sub-centres. The institutions under the allopathy system were<br />
1,310, with 46,800 beds – including 941 primary health<br />
centres, 107 community health centres and 143 hospitals.<br />
Each sub-centre in <strong>Kerala</strong> serves a population <strong>of</strong> about<br />
5,000 as against 4,581 at the all-India level, and each<br />
primary health centre, a population <strong>of</strong> more than<br />
25,000 and each community health centre, about 2.25 lakh.<br />
It should be noted that as in the case <strong>of</strong> school infrastructure,<br />
each medical institution in <strong>Kerala</strong> serves a larger population<br />
due to high density, but the area covered is much less than<br />
for all-India, which in fact ensures greater accessibility.<br />
Though the achievement in human development index<br />
does not vary significantly among the districts (as we see in<br />
Chapter 4), some <strong>of</strong> the input indicators such as number <strong>of</strong><br />
beds per 1,000 population and number <strong>of</strong> schools per lakh<br />
school-going population varied among the districts in <strong>Kerala</strong>.<br />
Map 2.2 gives the spatial variation <strong>of</strong> number <strong>of</strong> beds per<br />
1,000 population. The number <strong>of</strong> beds per 1,000 population<br />
is the lowest in the districts <strong>of</strong> Kasargod, Wayanad and<br />
Malappuram. This is the highest in Thiruvananthapuram,<br />
Alappuzha and Kozhikode districts. The estimated coefficient<br />
<strong>of</strong> variation is around 38 per cent.


