

Kerala 2005 - of Planning Commission
Kerala 2005 - of Planning Commission
Kerala 2005 - of Planning Commission

Create successful ePaper yourself
Turn your PDF publications into a flip-book with our unique Google optimized e-Paper software.
44<br />
2. Growth Pattern <strong>of</strong> the <strong>Kerala</strong> Economy<br />
2.1 Two Phases <strong>of</strong> Growth<br />
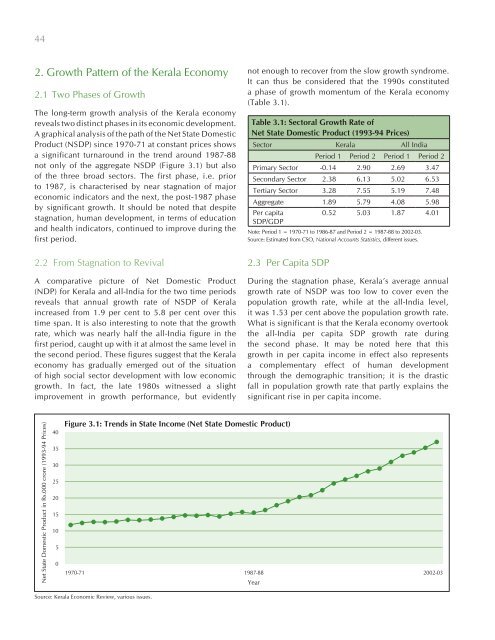
The long-term growth analysis <strong>of</strong> the <strong>Kerala</strong> economy<br />
reveals two distinct phases in its economic development.<br />
A graphical analysis <strong>of</strong> the path <strong>of</strong> the Net State Domestic<br />
Product (NSDP) since 1970-71 at constant prices shows<br />
a significant turnaround in the trend around 1987-88<br />
not only <strong>of</strong> the aggregate NSDP (Figure 3.1) but also<br />
<strong>of</strong> the three broad sectors. The first phase, i.e. prior<br />
to 1987, is characterised by near stagnation <strong>of</strong> major<br />
economic indicators and the next, the post-1987 phase<br />
by significant growth. It should be noted that despite<br />
stagnation, human development, in terms <strong>of</strong> education<br />
and health indicators, continued to improve during the<br />
first period.<br />
2.2 From Stagnation to Revival<br />
A comparative picture <strong>of</strong> Net Domestic Product<br />
(NDP) for <strong>Kerala</strong> and all-India for the two time periods<br />
reveals that annual growth rate <strong>of</strong> NSDP <strong>of</strong> <strong>Kerala</strong><br />
increased from 1.9 per cent to 5.8 per cent over this<br />
time span. It is also interesting to note that the growth<br />
rate, which was nearly half the all-India figure in the<br />
first period, caught up with it at almost the same level in<br />
the second period. These figures suggest that the <strong>Kerala</strong><br />
economy has gradually emerged out <strong>of</strong> the situation<br />
<strong>of</strong> high social sector development with low economic<br />
growth. In fact, the late 1980s witnessed a slight<br />
improvement in growth performance, but evidently<br />
not enough to recover from the slow growth syndrome.<br />
It can thus be considered that the 1990s constituted<br />
a phase <strong>of</strong> growth momentum <strong>of</strong> the <strong>Kerala</strong> economy<br />
(Table 3.1).<br />
Table 3.1: Sectoral Growth Rate <strong>of</strong><br />
Net State Domestic Product (1993-94 Prices)<br />
Sector <strong>Kerala</strong> All India<br />
Period 1 Period 2 Period 1 Period 2<br />
Primary Sector -0.14 2.90 2.69 3.47<br />
Secondary Sector 2.38 6.13 5.02 6.53<br />
Tertiary Sector 3.28 7.55 5.19 7.48<br />
Aggregate 1.89 5.79 4.08 5.98<br />
Per capita<br />
SDP/GDP<br />
0.52 5.03 1.87 4.01<br />
Note: Period 1 = 1970-71 to 1986-87 and Period 2 = 1987-88 to 2002-03.<br />
Source: Estimated from CSO, National Accounts Statistics, different issues.<br />
2.3 Per Capita SDP<br />
During the stagnation phase, <strong>Kerala</strong>’s average annual<br />
growth rate <strong>of</strong> NSDP was too low to cover even the<br />
population growth rate, while at the all-India level,<br />
it was 1.53 per cent above the population growth rate.<br />
What is significant is that the <strong>Kerala</strong> economy overtook<br />
the all-India per capita SDP growth rate during<br />
the second phase. It may be noted here that this<br />
growth in per capita income in effect also represents<br />
a complementary effect <strong>of</strong> human development<br />
through the demographic transition; it is the drastic<br />
fall in population growth rate that partly explains the<br />
significant rise in per capita income.


