Kerala 2005 - of Planning Commission
Kerala 2005 - of Planning Commission
Kerala 2005 - of Planning Commission
You also want an ePaper? Increase the reach of your titles
YUMPU automatically turns print PDFs into web optimized ePapers that Google loves.
CHAPTER 7<br />
RECKONING CAUTION: EDUCATED UNEMPLOYMENT AND GENDER UNFREEDOM<br />
105<br />
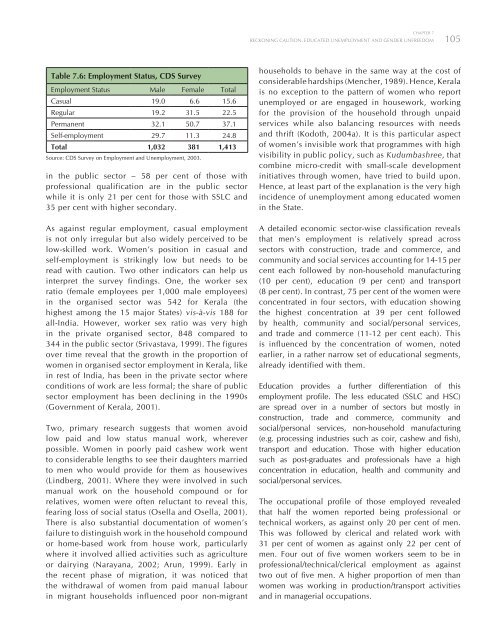
Table 7.6: Employment Status, CDS Survey<br />
Employment Status Male Female Total<br />
Casual 19.0 6.6 15.6<br />
Regular 19.2 31.5 22.5<br />
Permanent 32.1 50.7 37.1<br />
Self-employment 29.7 11.3 24.8<br />
Total 1,032 381 1,413<br />
Source: CDS Survey on Employment and Unemployment, 2003.<br />
in the public sector – 58 per cent <strong>of</strong> those with<br />
pr<strong>of</strong>essional qualification are in the public sector<br />
while it is only 21 per cent for those with SSLC and<br />
35 per cent with higher secondary.<br />
As against regular employment, casual employment<br />
is not only irregular but also widely perceived to be<br />
low-skilled work. Women’s position in casual and<br />
self-employment is strikingly low but needs to be<br />
read with caution. Two other indicators can help us<br />
interpret the survey findings. One, the worker sex<br />
ratio (female employees per 1,000 male employees)<br />
in the organised sector was 542 for <strong>Kerala</strong> (the<br />
highest among the 15 major States) vis-à-vis 188 for<br />
all-India. However, worker sex ratio was very high<br />
in the private organised sector, 848 compared to<br />
344 in the public sector (Srivastava, 1999). The figures<br />
over time reveal that the growth in the proportion <strong>of</strong><br />
women in organised sector employment in <strong>Kerala</strong>, like<br />
in rest <strong>of</strong> India, has been in the private sector where<br />
conditions <strong>of</strong> work are less formal; the share <strong>of</strong> public<br />
sector employment has been declining in the 1990s<br />
(Government <strong>of</strong> <strong>Kerala</strong>, 2001).<br />
Two, primary research suggests that women avoid<br />
low paid and low status manual work, wherever<br />
possible. Women in poorly paid cashew work went<br />
to considerable lengths to see their daughters married<br />
to men who would provide for them as housewives<br />
(Lindberg, 2001). Where they were involved in such<br />
manual work on the household compound or for<br />
relatives, women were <strong>of</strong>ten reluctant to reveal this,<br />
fearing loss <strong>of</strong> social status (Osella and Osella, 2001).<br />
There is also substantial documentation <strong>of</strong> women’s<br />
failure to distinguish work in the household compound<br />
or home-based work from house work, particularly<br />
where it involved allied activities such as agriculture<br />
or dairying (Narayana, 2002; Arun, 1999). Early in<br />
the recent phase <strong>of</strong> migration, it was noticed that<br />
the withdrawal <strong>of</strong> women from paid manual labour<br />
in migrant households influenced poor non-migrant<br />
households to behave in the same way at the cost <strong>of</strong><br />
considerable hardships (Mencher, 1989). Hence, <strong>Kerala</strong><br />
is no exception to the pattern <strong>of</strong> women who report<br />
unemployed or are engaged in housework, working<br />
for the provision <strong>of</strong> the household through unpaid<br />
services while also balancing resources with needs<br />
and thrift (Kodoth, 2004a). It is this particular aspect<br />
<strong>of</strong> women’s invisible work that programmes with high<br />
visibility in public policy, such as Kudumbashree, that<br />
combine micro-credit with small-scale development<br />
initiatives through women, have tried to build upon.<br />
Hence, at least part <strong>of</strong> the explanation is the very high<br />
incidence <strong>of</strong> unemployment among educated women<br />
in the State.<br />
A detailed economic sector-wise classification reveals<br />
that men’s employment is relatively spread across<br />
sectors with construction, trade and commerce, and<br />
community and social services accounting for 14-15 per<br />
cent each followed by non-household manufacturing<br />
(10 per cent), education (9 per cent) and transport<br />
(8 per cent). In contrast, 75 per cent <strong>of</strong> the women were<br />
concentrated in four sectors, with education showing<br />
the highest concentration at 39 per cent followed<br />
by health, community and social/personal services,<br />
and trade and commerce (11-12 per cent each). This<br />
is influenced by the concentration <strong>of</strong> women, noted<br />
earlier, in a rather narrow set <strong>of</strong> educational segments,<br />
already identified with them.<br />
Education provides a further differentiation <strong>of</strong> this<br />
employment pr<strong>of</strong>ile. The less educated (SSLC and HSC)<br />
are spread over in a number <strong>of</strong> sectors but mostly in<br />
construction, trade and commerce, community and<br />
social/personal services, non-household manufacturing<br />
(e.g. processing industries such as coir, cashew and fish),<br />
transport and education. Those with higher education<br />
such as post-graduates and pr<strong>of</strong>essionals have a high<br />
concentration in education, health and community and<br />
social/personal services.<br />
The occupational pr<strong>of</strong>ile <strong>of</strong> those employed revealed<br />
that half the women reported being pr<strong>of</strong>essional or<br />
technical workers, as against only 20 per cent <strong>of</strong> men.<br />
This was followed by clerical and related work with<br />
31 per cent <strong>of</strong> women as against only 22 per cent <strong>of</strong><br />
men. Four out <strong>of</strong> five women workers seem to be in<br />
pr<strong>of</strong>essional/technical/clerical employment as against<br />
two out <strong>of</strong> five men. A higher proportion <strong>of</strong> men than<br />
women was working in production/transport activities<br />
and in managerial occupations.


