

Kerala 2005 - of Planning Commission
Kerala 2005 - of Planning Commission
Kerala 2005 - of Planning Commission

You also want an ePaper? Increase the reach of your titles
YUMPU automatically turns print PDFs into web optimized ePapers that Google loves.
64<br />
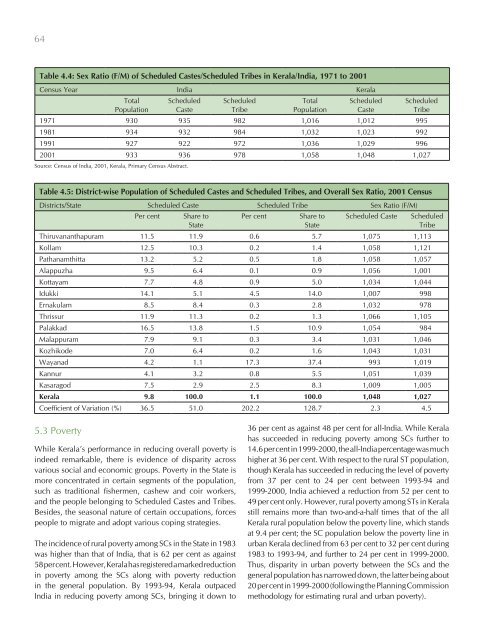
Table 4.4: Sex Ratio (F/M) <strong>of</strong> Scheduled Castes/Scheduled Tribes in <strong>Kerala</strong>/India, 1971 to 2001<br />
Census Year India <strong>Kerala</strong><br />
Total<br />
Population<br />
Scheduled<br />
Caste<br />
Scheduled<br />
Tribe<br />
Total<br />
Population<br />
Scheduled<br />
Caste<br />
Scheduled<br />
Tribe<br />
1971 930 935 982 1,016 1,012 995<br />
1981 934 932 984 1,032 1,023 992<br />
1991 927 922 972 1,036 1,029 996<br />
2001 933 936 978 1,058 1,048 1,027<br />
Source: Census <strong>of</strong> India, 2001, <strong>Kerala</strong>, Primary Census Abstract.<br />
Table 4.5: District-wise Population <strong>of</strong> Scheduled Castes and Scheduled Tribes, and Overall Sex Ratio, 2001 Census<br />
Districts/State Scheduled Caste Scheduled Tribe Sex Ratio (F/M)<br />
Per cent Share to<br />
State<br />
Per cent Share to<br />
State<br />
Scheduled Caste Scheduled<br />
Tribe<br />
Thiruvananthapuram 11.5 11.9 0.6 5.7 1,075 1,113<br />
Kollam 12.5 10.3 0.2 1.4 1,058 1,121<br />
Pathanamthitta 13.2 5.2 0.5 1.8 1,058 1,057<br />
Alappuzha 9.5 6.4 0.1 0.9 1,056 1,001<br />
Kottayam 7.7 4.8 0.9 5.0 1,034 1,044<br />
Idukki 14.1 5.1 4.5 14.0 1,007 998<br />
Ernakulam 8.5 8.4 0.3 2.8 1,032 978<br />
Thrissur 11.9 11.3 0.2 1.3 1,066 1,105<br />
Palakkad 16.5 13.8 1.5 10.9 1,054 984<br />
Malappuram 7.9 9.1 0.3 3.4 1,031 1,046<br />
Kozhikode 7.0 6.4 0.2 1.6 1,043 1,031<br />
Wayanad 4.2 1.1 17.3 37.4 993 1,019<br />
Kannur 4.1 3.2 0.8 5.5 1,051 1,039<br />
Kasaragod 7.5 2.9 2.5 8.3 1,009 1,005<br />
<strong>Kerala</strong> 9.8 100.0 1.1 100.0 1,048 1,027<br />
Coefficient <strong>of</strong> Variation (%) 36.5 51.0 202.2 128.7 2.3 4.5<br />
5.3 Poverty<br />
While <strong>Kerala</strong>’s performance in reducing overall poverty is<br />
indeed remarkable, there is evidence <strong>of</strong> disparity across<br />
various social and economic groups. Poverty in the State is<br />
more concentrated in certain segments <strong>of</strong> the population,<br />
such as traditional fishermen, cashew and coir workers,<br />
and the people belonging to Scheduled Castes and Tribes.<br />
Besides, the seasonal nature <strong>of</strong> certain occupations, forces<br />
people to migrate and adopt various coping strategies.<br />
The incidence <strong>of</strong> rural poverty among SCs in the State in 1983<br />
was higher than that <strong>of</strong> India, that is 62 per cent as against<br />
58 per cent. However, <strong>Kerala</strong> has registered a marked reduction<br />
in poverty among the SCs along with poverty reduction<br />
in the general population. By 1993-94, <strong>Kerala</strong> outpaced<br />
India in reducing poverty among SCs, bringing it down to<br />
36 per cent as against 48 per cent for all-India. While <strong>Kerala</strong><br />
has succeeded in reducing poverty among SCs further to<br />
14.6 per cent in 1999-2000, the all-India percentage was much<br />
higher at 36 per cent. With respect to the rural ST population,<br />
though <strong>Kerala</strong> has succeeded in reducing the level <strong>of</strong> poverty<br />
from 37 per cent to 24 per cent between 1993-94 and<br />
1999-2000, India achieved a reduction from 52 per cent to<br />
49 per cent only. However, rural poverty among STs in <strong>Kerala</strong><br />
still remains more than two-and-a-half times that <strong>of</strong> the all<br />
<strong>Kerala</strong> rural population below the poverty line, which stands<br />
at 9.4 per cent; the SC population below the poverty line in<br />
urban <strong>Kerala</strong> declined from 63 per cent to 32 per cent during<br />
1983 to 1993-94, and further to 24 per cent in 1999-2000.<br />
Thus, disparity in urban poverty between the SCs and the<br />
general population has narrowed down, the latter being about<br />
20 per cent in 1999-2000 (following the <strong>Planning</strong> <strong>Commission</strong><br />
methodology for estimating rural and urban poverty).


