

Kerala 2005 - of Planning Commission
Kerala 2005 - of Planning Commission
Kerala 2005 - of Planning Commission

You also want an ePaper? Increase the reach of your titles
YUMPU automatically turns print PDFs into web optimized ePapers that Google loves.
170<br />
4. Calculating the HDI<br />
The three dimension indices have been used to<br />
compute the HDI. It is a simple average <strong>of</strong> the three<br />
dimension indices.<br />
HDI = (1/3)*(income index + life expectancy index +<br />
education index)<br />
The HDI for <strong>Kerala</strong> is HDI (<strong>Kerala</strong>) = (1/3) (0.562 +<br />
0.827 + 0.910) = 0.773<br />
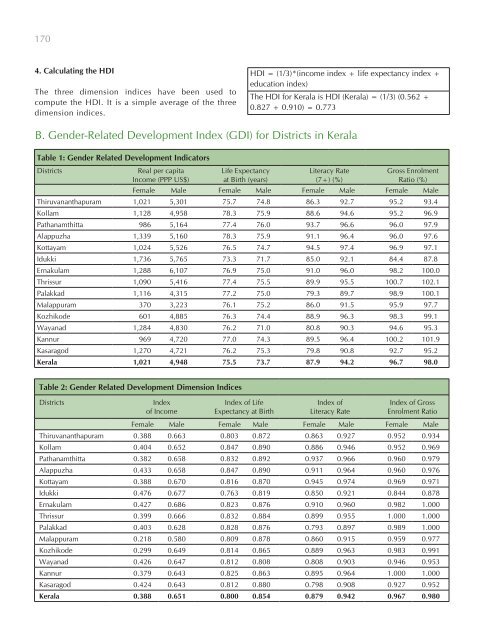
B. Gender-Related Development Index (GDI) for Districts in <strong>Kerala</strong><br />
Table 1: Gender Related Development Indicators<br />
Districts<br />
Real per capita<br />
Income (PPP US$)<br />
Life Expectancy<br />
at Birth (years)<br />
Literacy Rate<br />
(7+) (%)<br />
Gross Enrolment<br />
Ratio (%)<br />
Female Male Female Male Female Male Female Male<br />
Thiruvananthapuram 1,021 5,301 75.7 74.8 86.3 92.7 95.2 93.4<br />
Kollam 1,128 4,958 78.3 75.9 88.6 94.6 95.2 96.9<br />
Pathanamthitta 986 5,164 77.4 76.0 93.7 96.6 96.0 97.9<br />
Alappuzha 1,339 5,160 78.3 75.9 91.1 96.4 96.0 97.6<br />
Kottayam 1,024 5,526 76.5 74.7 94.5 97.4 96.9 97.1<br />
Idukki 1,736 5,765 73.3 71.7 85.0 92.1 84.4 87.8<br />
Ernakulam 1,288 6,107 76.9 75.0 91.0 96.0 98.2 100.0<br />
Thrissur 1,090 5,416 77.4 75.5 89.9 95.5 100.7 102.1<br />
Palakkad 1,116 4,315 77.2 75.0 79.3 89.7 98.9 100.1<br />
Malappuram 370 3,223 76.1 75.2 86.0 91.5 95.9 97.7<br />
Kozhikode 601 4,885 76.3 74.4 88.9 96.3 98.3 99.1<br />
Wayanad 1,284 4,830 76.2 71.0 80.8 90.3 94.6 95.3<br />
Kannur 969 4,720 77.0 74.3 89.5 96.4 100.2 101.9<br />
Kasaragod 1,270 4,721 76.2 75.3 79.8 90.8 92.7 95.2<br />
<strong>Kerala</strong> 1,021 4,948 75.5 73.7 87.9 94.2 96.7 98.0<br />
Table 2: Gender Related Development Dimension Indices<br />
Districts<br />
Index<br />
<strong>of</strong> Income<br />
Index <strong>of</strong> Life<br />
Expectancy at Birth<br />
Index <strong>of</strong><br />
Literacy Rate<br />
Index <strong>of</strong> Gross<br />
Enrolment Ratio<br />
Female Male Female Male Female Male Female Male<br />
Thiruvananthapuram 0.388 0.663 0.803 0.872 0.863 0.927 0.952 0.934<br />
Kollam 0.404 0.652 0.847 0.890 0.886 0.946 0.952 0.969<br />
Pathanamthitta 0.382 0.658 0.832 0.892 0.937 0.966 0.960 0.979<br />
Alappuzha 0.433 0.658 0.847 0.890 0.911 0.964 0.960 0.976<br />
Kottayam 0.388 0.670 0.816 0.870 0.945 0.974 0.969 0.971<br />
Idukki 0.476 0.677 0.763 0.819 0.850 0.921 0.844 0.878<br />
Ernakulam 0.427 0.686 0.823 0.876 0.910 0.960 0.982 1.000<br />
Thrissur 0.399 0.666 0.832 0.884 0.899 0.955 1.000 1.000<br />
Palakkad 0.403 0.628 0.828 0.876 0.793 0.897 0.989 1.000<br />
Malappuram 0.218 0.580 0.809 0.878 0.860 0.915 0.959 0.977<br />
Kozhikode 0.299 0.649 0.814 0.865 0.889 0.963 0.983 0.991<br />
Wayanad 0.426 0.647 0.812 0.808 0.808 0.903 0.946 0.953<br />
Kannur 0.379 0.643 0.825 0.863 0.895 0.964 1.000 1.000<br />
Kasaragod 0.424 0.643 0.812 0.880 0.798 0.908 0.927 0.952<br />
<strong>Kerala</strong> 0.388 0.651 0.800 0.854 0.879 0.942 0.967 0.980


