

Kerala 2005 - of Planning Commission
Kerala 2005 - of Planning Commission
Kerala 2005 - of Planning Commission

You also want an ePaper? Increase the reach of your titles
YUMPU automatically turns print PDFs into web optimized ePapers that Google loves.
56<br />
However, let us look at another measure. Guhan (1994)<br />
has stated that it is possible to have resources for<br />
social security at the national level by cutting military<br />
expenditure and subsidies for non-poor, and argued that<br />
doubling the proportion <strong>of</strong> social security expenditure<br />
from 1.5 per cent <strong>of</strong> the GDP to 3 per cent is feasible.<br />
In the regional context, if the State can tap more tax<br />
revenue by checking the alarming proportions <strong>of</strong> sales<br />
tax evasion and mobilise more non-tax revenue from<br />
education, 19 health and for several economic services<br />
from sections <strong>of</strong> population who can afford to pay, it is<br />
quite feasible that vulnerable sections can be extended<br />
benefits that will provide the critical minimum to rise<br />
above the poverty level.<br />
There are also multiple Centrally-sponsored schemes,<br />
whose structure is inflexible with regard to specific<br />
problems <strong>of</strong> the State and at the same time impose a fiscal<br />
burden on the State by way <strong>of</strong> requirement <strong>of</strong> matching<br />
contributions. There have already been suggestions at<br />
the <strong>of</strong>ficial level to transfer these existing schemes along<br />
with the funds to the State Governments. If these are<br />
translated into reality, a modest target <strong>of</strong> pension schemes<br />
at 1 or even 1.5 per cent <strong>of</strong> the State domestic product<br />
will not hinder the <strong>of</strong>ficially laid down targets <strong>of</strong> fiscal<br />
consolidation.<br />
In an inter-State comparison <strong>of</strong> per capita social security<br />
and welfare expenditure (SSW) 20 for the population below<br />
poverty line, <strong>Kerala</strong> ranks third below Haryana and Punjab,<br />
and only marginally ahead <strong>of</strong> Tamil Nadu (Table 3.12).<br />
When the per capita SSW is computed for the whole<br />
population, it shows that <strong>Kerala</strong> ranks third below Haryana<br />
and Tamil Nadu. Bihar is at the bottom <strong>of</strong> per capita SSW<br />
expenditure. 21<br />
As a measure <strong>of</strong> sustainability <strong>of</strong> this component <strong>of</strong><br />
expenditure, ratio <strong>of</strong> non-Plan to Plan expenditure is taken.<br />
It is very high for Maharashtra, Rajasthan and Tamil Nadu.<br />
It is 2.02 for <strong>Kerala</strong>. The deficit targeting approach to fiscal<br />
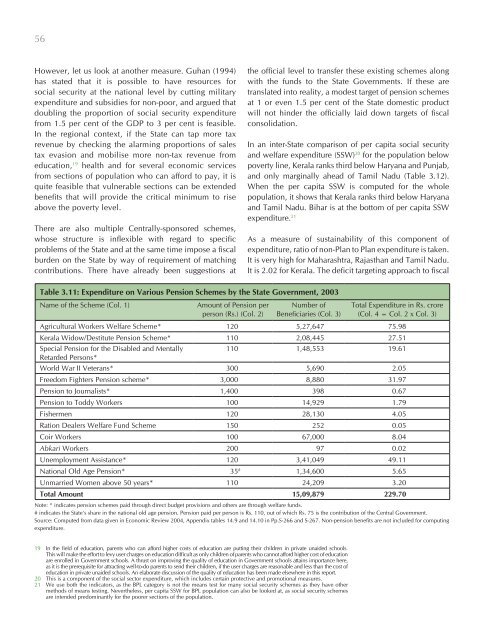
Table 3.11: Expenditure on Various Pension Schemes by the State Government, 2003<br />
Name <strong>of</strong> the Scheme (Col. 1)<br />
Amount <strong>of</strong> Pension per<br />
person (Rs.) (Col. 2)<br />
Number <strong>of</strong><br />
Beneficiaries (Col. 3)<br />
Total Expenditure in Rs. crore<br />
(Col. 4 = Col. 2 x Col. 3)<br />
Agricultural Workers Welfare Scheme* 120 5,27,647 75.98<br />
<strong>Kerala</strong> Widow/Destitute Pension Scheme* 110 2,08,445 27.51<br />
Special Pension for the Disabled and Mentally<br />
110 1,48,553 19.61<br />
Retarded Persons*<br />
World War II Veterans* 300 5,690 2.05<br />
Freedom Fighters Pension scheme* 3,000 8,880 31.97<br />
Pension to Journalists* 1,400 398 0.67<br />
Pension to Toddy Workers 100 14,929 1.79<br />
Fishermen 120 28,130 4.05<br />
Ration Dealers Welfare Fund Scheme 150 252 0.05<br />
Coir Workers 100 67,000 8.04<br />
Abkari Workers 200 97 0.02<br />
Unemployment Assistance* 120 3,41,049 49.11<br />
National Old Age Pension* 35 # 1,34,600 5.65<br />
Unmarried Women above 50 years* 110 24,209 3.20<br />
Total Amount 15,09,879 229.70<br />
Note: * indicates pension schemes paid through direct budget provisions and others are through welfare funds.<br />
# indicates the State’s share in the national old age pension. Pension paid per person is Rs. 110, out <strong>of</strong> which Rs. 75 is the contribution <strong>of</strong> the Central Government.<br />
Source: Computed from data given in Economic Review 2004, Appendix tables 14.9 and 14.10 in Pp.S-266 and S-267. Non-pension benefits are not included for computing<br />
expenditure.<br />
19 In the field <strong>of</strong> education, parents who can afford higher costs <strong>of</strong> education are putting their children in private unaided schools.<br />
This will make the effort to levy user charges on education difficult as only children <strong>of</strong> parents who cannot afford higher cost <strong>of</strong> education<br />
are enrolled in Government schools. A thrust on improving the quality <strong>of</strong> education in Government schools attains importance here,<br />
as it is the prerequisite for attracting well-to-do parents to send their children, if the user charges are reasonable and less than the cost <strong>of</strong><br />
education in private unaided schools. An elaborate discussion <strong>of</strong> the quality <strong>of</strong> education has been made elsewhere in this report.<br />
20 This is a component <strong>of</strong> the social sector expenditure, which includes certain protective and promotional measures.<br />
21 We use both the indicators, as the BPL category is not the means test for many social security schemes as they have other<br />
methods <strong>of</strong> means testing. Nevertheless, per capita SSW for BPL population can also be looked at, as social security schemes<br />
are intended predominantly for the poorer sections <strong>of</strong> the population.


