the state of water resources the state of environment in Brazil Basins was recently launched by the National Waters Agency – ANA (Agência Nacional de Águas) in order to stimulate the implementation of tributaries treatment systems and the increase of existing efficiency Other initiatives have also been taken in order to improve water quality by means of a direct financial return to the service provider in view of both the quantity of water treated and the quality of the final product This is an innovation action bound to be successful 12 Urban - Industrial Supply - Contamination by Tributary In 1940 the Brazilian population comprised 40M inhabitants of which 12,8 million lived in urban centres while the majority of the population lived in rural areas By the beginning of this century, the Brazilian population had increased fourfold and the relationship had changed completely: today over 80 percent of the Brazilian population live in cities The evolution analysis of sanitation services supply levels in Brazil reveal that substantial improvement has occurred only in water supply services primarily provided to the urban population In numerical terms, during the period between 1970 and 2000, the urban population increased 137 percent, going from 52 milion to around 123 milion In a similar way, the number of households served with water distribution networks increased from 60 to 91 percent Around 11 milion people who live in cities do not have access to water through the network In the rural area, 9 percent of the population is somehow connected to the drinking water network It is worth mentioning, though, that the larger part of this population is supplied directly by wells and springs and the poor regions concentrate the population most in need of sanitation services According to the Ministry of Health, 65 percent of hospitalisations result from inadequate sanitation services and actions, dysentery is responsible, for 50 thousand infant deaths per year, the majority under one year of age The institutional model based on State Sanitation Companies, resulting from the National Sanitation Plan – PLANASA (Plano Nacional de Saneamento), created in 1971 and discontinued in 1986, was definitely capable of changing the supplying index before the 1960s However, excessive centralisation in the companies, which conditioned fund raising to the municipality adhesion to the system, was responsible for the creation of bureaucratic structures dettached from the reality and incapable of operating either physical or financial solutions Greater challenges have been faced by the few existing municipal services which, in the absence of funding sources, establish compulsory mechanisms, instruments and innovating solutions which guarantee, within small operational structures, certain financial health Chart 2 gives an overall view of services supply throughout the Brazilian regions by indicating the main suppliers and the population being served According to the Ministry of Planning and Budget and the Urban Policy Secretariat’s data (MPO / MPSS (Ministério do Planejamento e Orçamento / Secretaria de Política Urbana) and according to diagnosis from the Sanitation Sector: Financial and Economic Studies, Brasília, 1995, in order to reach the water and sewage services universalisation target for the entire Brazilian population, investments of approximately US$42 billion within a period of around 20 years would be necessary On the other hand, the supply of sewage collection and disposal services is still rather inadequate even in large cities and reaches 15 percent of its intended coverage only When sewage treatment systems are included in this analysis the coverage index drops to 8 percent only Considering basic sanitation in a broader sense, it can be noticed that the deficiencies caused by a chronic absence of collecting systems and adequate destination of final solid residues help to form the picture that is largely responsible, in great part, for the public health problems that affect mainly the low income population The large cities suburbs, the small urban agglomerations In 1995, the National Information System on Sanitation was institutionalised It represents a fundamental instrument for the efficiency of sanitation services supply and it is indispensable to the implementation of the sector’s regulatory framework The referred system is anchored in the implementation of an environmental sanitation data bank and in the use of performance indicators One aspect worth noticing regarding the sector’s organisation is the insufficient link with programmes and activities in other areas, especially those related to the environment and water resource management There is a 80
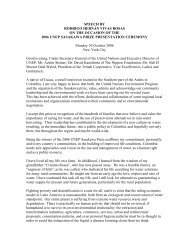
Chart 2 - P opulation s erved w ith w ater and s ew age Regions / State Municipalities S erved municipalities Served P laces Total populationof s erved municipalities Urbanpopulationof s erved municipalities T otal Water S ew age Water S ew age Water S ew age Water S ew age Municipalities H Qs H Qs P laces P laces Inhabitants Inhabitants Inhabitants Inhabitants North Region CAER/RR 15 15 1 7 0 266,922 167,185 203,316 163,390 CAERD/RO 36 36 2 14 0 735,612 280,286 CAESA/AP 14 14 6 23 0 432,395 374,732 390,302 351,352 COSAMA/AM 46 46 1 46 1 2,198,732 1,255,049 2,970,545 1,573,152 COSANPA/PA 62 62 1 13 1 4,146,861 1,246,088 2,395,593 861,372 DEAS/AC 15 15 1 236,899 107,689 SANEATINS/TO 125 125 3 225 1 1,024,233 256,579 713,489 242,472 North Region Total 313 313 14 329 3 8,306,042 3,299,633 7,516,546 3,472,024 the state of environment in Brazil Northeast Region AGESPISA/PI 134 134 2 11 0 2,337,808 756,311 1,655,583 707,274 CAEMA/MA 132 132 2 21 0 3,848,023 247,380 1,874,820 1,083,036 CAERN/RN 140 140 25 13 0 2,332,271 1,395,280 1,875,296 1,261,274 CAGECE/CE 132 132 11 45 0 5,506,762 2,954,179 4,175,170 2,843,256 CAGEPA/PB 167 167 12 16 0 3,085,199 1,517,502 2,572,010 1,506,321 CASAL/AL 80 80 1 84 1 2,276,666 786,288 1,533,897 742,026 COMPESA/PE 174 168 6 74 0 7,231,387 3,825,641 5,449,191 3,546,408 DESO/SE 71 70 3 253 0 1,612,263 557,634 1,156,723 503,965 EMBASA/BA 342 335 23 540 6 11,003,983 4,698,722 7,294,097 4,155,763 Northeast Region Total 1,372 1,358 85 1,057 7 39,234,362 16,738,937 27,586,787 16,349,323 Southeast Region CEDAE/RJ 61 59 6 160 0 11,273,517 8,146,916 10,769,065 7,782,369 CESAN/ES 52 52 11 160 17 2,076,511 1,445,201 1,722,897 1,336,627 COPASA/MG 513 513 53 72 8 11,524,145 5,555,878 10,035,920 5,548,262 SABESP/SP 366 366 365 339 339 21,274,244 20,614,640 19,181,000 19,107,000 Southeast Region Total 992 990 435 731 364 46,148,417 35,762,635 41,708,882 33,774,258 South Region CASAN/SC 220 220 9 94 4 3,980,440 1,279,390 3,008,349 1,200,892 CORSAN/RS 308 308 38 27 6 6,663,197 2,858,653 5,605,570 3,440,574 SANEPAR/PR 342 342 128 277 6 8,660,005 6,885,222 7,467,010 6,252,787 South Region Total 870 870 175 398 16 19,303,642 11,023,266 16,080,929 10,894,253 Midwest Region CAESB/DF 1 1 1 19 19 1,969,868 1,969,868 1,850,733 1,850,733 SANEAGO/GO 219 219 24 28 0 4,529,832 2,299,185 4,326,880 2,648,538 SANEMAT/MT 71 71 3 2 0 788,062 47,494 468,941 37,552 SANESUL/MS 68 68 11 48 0 1,285,780 521,911 1,033,328 439,215 Midwest Region Total 359 359 39 97 19 8,573,542 4,838,458 7,679,882 4,976,038 Group Total 3,906 3,890 748 2,612 409 121,566,005 71,662,929 100,573,026 69,465,896 Diagnosis of Water and Sewage Services - 1999 General Information - Regional scope service renderers The quantities of municipal HQs are not contained in location quantities Source: National Information System on Sanitation SNIS-SEDU/PR - 1999 81
- Page 1:
United Nations Environment Programm
- Page 4 and 5:
IPEA Instituto de Pesquisas Econôm
- Page 6 and 7:
GEO Brazil 2002- Brazil Environment
- Page 8 and 9:
presentation of the Minister of Sta
- Page 10 and 11:
UNEP Presentation Introduction to E
- Page 12 and 13:
These are aspects that provide moti
- Page 14 and 15:
Chapter 2 .........................
- Page 16 and 17:
8.9 Habitat Loss and Biodiversity -
- Page 18 and 19:
2.1 Precedents: Rio 92 and Agenda 2
- Page 20 and 21:
Overview ..........................
- Page 22 and 23:
list of pictures Chapter 1 Introduc
- Page 24 and 25:
The state of forests Table 1 Natura
- Page 26 and 27:
Table 8 Annual average growth rate
- Page 28 and 29:
Figure 6 Indigenous lands likely to
- Page 31 and 32:
introduction 1. IDENTITY AND TERRIT
- Page 33 and 34:
The underlying principle guiding th
- Page 35 and 36:
1.4. Report’s Structure and Conte
- Page 37 and 38:
The ANNEXES in the end of this repo
- Page 39 and 40:
2. Current Status and Perspectives
- Page 41 and 42:
An interesting system to define pos
- Page 43 and 44:
Some relevant aspects rise in the i
- Page 45 and 46:
What has been proposed as a mechani
- Page 47 and 48:
The second reason is the short term
- Page 49 and 50:
A redesign of the institutional str
- Page 51 and 52:
chapter 2 the state of the the stat
- Page 53 and 54:
territorial dynamics and the enviro
- Page 55 and 56:
cycle, which at its time was the mo
- Page 57 and 58: 200 - 500 inhabitants - which in 19
- Page 59 and 60: This new environmental division of
- Page 61 and 62: Superior plants, despite betterclas
- Page 63: Figure 1-Proportion of taxons of or
- Page 66 and 67: the state of biodiversity the state
- Page 68 and 69: the state of biodiversity the state
- Page 70 and 71: the state of biodiversity the state
- Page 72 and 73: the state of biodiversity the state
- Page 74 and 75: the state of biodiversity the state
- Page 76 and 77: soil conditions the state of the en
- Page 78 and 79: soil conditions 12 Land potential u
- Page 80: soil conditions the state of the en
- Page 83 and 84: the Northeast In 1998, average farm
- Page 85 and 86: In ha Figure 4 - A verage area of h
- Page 87 and 88: A distance concept (in metres L 1 )
- Page 89 and 90: that, it may be a possible solution
- Page 91 and 92: m 3 in agricultural lands and 448 b
- Page 93 and 94: environmental availability (shallow
- Page 95 and 96: All and any human activity leads to
- Page 97 and 98: Figure 1 - Geologic units that are
- Page 99 and 100: Table 1 - Environmental Impacts on
- Page 101 and 102: Figure 3 - Impact of gold prospecti
- Page 103 and 104: 23 Environmental Impacts resulting
- Page 105 and 106: the state of environment in Brazil
- Page 107: shortage in the Northeastern region
- Page 111 and 112: carried out as far as requests for
- Page 113 and 114: generation Hydro-electric generatio
- Page 115 and 116: the use of the soil do not exacerba
- Page 117 and 118: of water levels in water wells resu
- Page 119 and 120: Barreiras Group, sandy re-covering
- Page 121 and 122: consolidated The dominant aquifers
- Page 123 and 124: Thus, the volume produced by a well
- Page 125 and 126: is already understood that the cons
- Page 127 and 128: the state of forests Approximately
- Page 129 and 130: the 1960s, wood was really not a re
- Page 131 and 132: Programme for Vegetal Charcoal-Base
- Page 133 and 134: artefacts, it can reach up to US$15
- Page 135 and 136: of the subject- ranging from quanti
- Page 137 and 138: the state of the atmosphere The res
- Page 139 and 140: destructive substances The Vienna C
- Page 141 and 142: 4 Brazil and the Climatic Change Co
- Page 143 and 144: effect gas emission than gasoline R
- Page 145 and 146: Thousand ha/year by satellite image
- Page 147 and 148: Brazilian marine and coastal enviro
- Page 149 and 150: ) The gradual expansion of the city
- Page 151 and 152: Concerning the rubbish, 90 percent
- Page 153 and 154: 5 Tourism Nowadays, tourism represe
- Page 155 and 156: Criciúma, Imbituba and Tubarão pr
- Page 157 and 158: the state of the environment in Bra
- Page 159 and 160:
the state of the environment in Bra
- Page 161 and 162:
The productivity of the North is hi
- Page 163 and 164:
quality of the post-larvae, and the
- Page 165 and 166:
level of sustainability Some have e
- Page 167 and 168:
activity was initiated in the late
- Page 169 and 170:
a tendency to decrease was observed
- Page 171 and 172:
presented at least two possible cau
- Page 173 and 174:
of the main marine fishing resource
- Page 175 and 176:
protozoans and helminths that can b
- Page 177 and 178:
c) Biological: dengue, yellow fever
- Page 179 and 180:
There is a great need for a governm
- Page 181 and 182:
the state of the environment in Bra
- Page 183 and 184:
The dry season, as a disaster, is r
- Page 185 and 186:
to cutting and burning forests for
- Page 187 and 188:
Hail causes great losses in agricul
- Page 189 and 190:
Accidents with Oil Spills The petro
- Page 191 and 192:
NORTH REGION The North covers nearl
- Page 193 and 194:
A lack of proper environmental awar
- Page 195 and 196:
SOUTHEAST REGION The Southeast Regi
- Page 197 and 198:
occurs in winter, and the minimum l
- Page 199 and 200:
the state of the environment in Bra
- Page 201 and 202:
growth rate and a slow down of this
- Page 203 and 204:
There were later relatively stable
- Page 205 and 206:
From that time on, demographic conc
- Page 207 and 208:
Map 3 - Migration balance 1986 - 19
- Page 209 and 210:
Table9-StructureoftheBrazilian indu
- Page 211 and 212:
34 Industrialisation and Spatial Re
- Page 213 and 214:
obstacle to credit access and to of
- Page 215 and 216:
most important action, therefore, i
- Page 217 and 218:
In the Brazilian metropolitan regio
- Page 219 and 220:
activities are more concentrated an
- Page 221 and 222:
Another biomass power source adopte
- Page 223 and 224:
ecreational activity In addition to
- Page 225 and 226:
115 Impact Indicators 1151 Health D
- Page 227 and 228:
US$325 million/year) This amount is
- Page 229 and 230:
Regarding the historical perspectiv
- Page 231 and 232:
In 1999, homicides ranked first in
- Page 233 and 234:
123 Infectious and parasitic diseas
- Page 235 and 236:
The state of health and the environ
- Page 237 and 238:
The state of health and the environ
- Page 239 and 240:
eassessment by North American healt
- Page 241 and 242:
indicating the organisms were alrea
- Page 243 and 244:
125Atmospheric Pollution Atmospheri
- Page 245 and 246:
Every year, landslides during heavy
- Page 247 and 248:
chapter 3 policies feedback
- Page 249 and 250:
policies feedback 1. Inheritance an
- Page 251 and 252:
However, CCZEE limited itself to im
- Page 253 and 254:
2. International Agreements Resulti
- Page 255 and 256:
policies feedback 227
- Page 257 and 258:
During recent years a few legal tex
- Page 259 and 260:
policies feedback 231
- Page 261 and 262:
Within the decentralisation issue l
- Page 263 and 264:
Because of these actions, concern f
- Page 265 and 266:
4. Sectorial Policy Responses and A
- Page 267 and 268:
criteria for the creation and manag
- Page 269 and 270:
Pantanal areas (www.bdt. fat.org.br
- Page 271 and 272:
populations, the maintenance of the
- Page 273 and 274:
4.2. Soil Governmental actions that
- Page 275 and 276:
a) To run a trend and stateanalysis
- Page 277 and 278:
as propellants for their aerosol sy
- Page 279 and 280:
4.2.3. Positive Impacts from the Us
- Page 281 and 282:
and São Paulo), or by elaborating
- Page 283 and 284:
possibilities of their use should b
- Page 285 and 286:
charging on productive processes as
- Page 287 and 288:
In general, the instituted model is
- Page 289 and 290:
4.4.5. Regulation It is demonstrate
- Page 291 and 292:
Parallel to the investigation effor
- Page 293 and 294:
monitoring and controlling forest u
- Page 295 and 296:
However, there are important knowle
- Page 297 and 298:
This total of 34.65 MtCO 2, during
- Page 299 and 300:
a) labelling programmeme to inform
- Page 301 and 302:
4.6.4. Specific Actions to Combat A
- Page 303 and 304:
4.7 Coastal and Sea Areas One of th
- Page 305 and 306:
4.8. Fishing The first aspect to be
- Page 307 and 308:
e) Creation of CEPED agencies - Aca
- Page 309 and 310:
Again, institutionally, a Secretary
- Page 311 and 312:
dissatisfaction by 50 per cent, by
- Page 313 and 314:
Urban environmental management also
- Page 315 and 316:
Despite being FUNASA’s direct res
- Page 317 and 318:
5. Challenges The government’s pr
- Page 319:
progressive lead Brazil towards the
- Page 323 and 324:
environmental management Overview C
- Page 325 and 326:
1. The Continuation of Environmenta
- Page 327 and 328:
Itajaí, and Florianópolis (SC), i
- Page 329 and 330:
Deforestation and cattle raising fo
- Page 331 and 332:
In the Pantanal Complex, native veg
- Page 333 and 334:
environmental management 305
- Page 335 and 336:
Chart 1-TrendScenario - Pressurre-I
- Page 337 and 338:
With regard to the plan for financi
- Page 339 and 340:
c) policies or actions that are not
- Page 341 and 342:
Desired Scenario - Impact-Response
- Page 343 and 344:
Table 1 - Deforestation expected al
- Page 345:
chapter 5 recommendations 317
- Page 348 and 349:
ecommendations decisive in the cons
- Page 350 and 351:
ecommendations d) Inter relationshi
- Page 352 and 353:
ecommendations c) that the governme
- Page 354 and 355:
6.6 Scenarios 6.7. Biodiversity and
- Page 356 and 357:
ecommendations 7.1. To reinfor einf
- Page 358 and 359:
ecommendations 8.3. Vulnerability a
- Page 361:
annexes es
- Page 364 and 365:
GEO Report - Statistical Annex - Me
- Page 366 and 367:
annex 1 - statistics - metadata ann
- Page 368 and 369:
annex 1 - statistics - metadata ann
- Page 370 and 371:
annex 1 - statistics - metadata ann
- Page 372 and 373:
annex 1 - statistics - metadata ann
- Page 374 and 375:
annex 1 - statistics - metadata Sou
- Page 376 and 377:
annex 1 - statistics - metadata ann
- Page 378 and 379:
annex 1 - statistics - metadata ann
- Page 380 and 381:
annex 1 - statistics - metadata ann
- Page 382 and 383:
annex 1 - statistics -metadata anne
- Page 384 and 385:
annex 1 - statistics -metadata anne
- Page 386 and 387:
annex 1 - statistics -metadata anne
- Page 388 and 389:
annex 1 - statistics -metadata anne
- Page 390 and 391:
annex 1 - statistics -metadata anne
- Page 392 and 393:
annex 1 - statistics -metadata anne
- Page 394 and 395:
annex 1 - statistics -metadata B.7.
- Page 396 and 397:
annex 1 - statistics -metadata B.7.
- Page 398 and 399:
annex 1 - statistics -metadata B.7.
- Page 400 and 401:
annex 1 - statistics -metadata anne
- Page 402 and 403:
A. Socioeconomic and cultural facto
- Page 404 and 405:
A. State of the Environment and Tre
- Page 406 and 407:
B. Socioeconomic and Cultural Facto
- Page 408 and 409:
B. Socioeconomic and Cultural Facto
- Page 410 and 411:
annex 2 - main economic and environ
- Page 412 and 413:
annex 2 - main economic and environ
- Page 414 and 415:
annex 2 - main economic and environ
- Page 416 and 417:
annex x 3 - biodiversity annex 3 Th
- Page 418 and 419:
annex 3 - biodiversity anexo 3 The
- Page 420 and 421:
annex 3 - biodiversity annex 3 The
- Page 422 and 423:
annex 3 - biodiversity annex 3 394
- Page 424 and 425:
anexo 3 - biodiversity annex 3 396
- Page 426 and 427:
annex 4 - compilation of brazilian
- Page 428 and 429:
anexo 4 3. BIODIVERSITY LAW 5.197 0
- Page 430 and 431:
annex 4 - compilation of brazilian
- Page 432 and 433:
annex 4 - compilation of brazilian
- Page 434 and 435:
annex 4 - compilation of brazilian
- Page 436 and 437:
annex 4 - compilation of brazilian
- Page 438 and 439:
anexo 4 DECREE 03/22/1997 Regulates
- Page 440 and 441:
colaboradores anexo 2 FIOCRUZ - Fun
- Page 442 and 443:
ibliografia ASSOCIAÇÃO NACIONAL D
- Page 444 and 445:
ibliografia _____. Governo do Brasi
- Page 446 and 447:
ibliografia CASTAGNOLLI, N. Aquicul
- Page 448 and 449:
ibliografia _____. (2002a).Centro N
- Page 450 and 451:
ibliografia EMPRESA BRASILEIRA DE P
- Page 452 and 453:
ibliografia FUNDAÇÃO SOS MATA ATL
- Page 454 and 455:
ibliografia _____. Recursos pesquei
- Page 456 and 457:
ibliografia KAGEYAMA P.Y. SOUZA L.M
- Page 458 and 459:
ibliografia MACHADO, G.V. Estimativ
- Page 460 and 461:
ibliografia _____.; Secretaria Espe
- Page 462 and 463:
ibliografia PARANÁ. Casa Civil - C
- Page 464 and 465:
ibliografia REDE INTRAGERENCIAL DE
- Page 466 and 467:
ibliografia SANTOS, J. R., T. KRUG,
- Page 468 and 469:
ibliografia TRAFFIC. 2000. El merca
- Page 470 and 471:
glossary y of the acronyms glossary
- Page 472 and 473:
CESP - Companhia Energética de Sã
- Page 474 and 475:
IPT - Instituto de Pesquisas Tecnol
- Page 476 and 477:
REVIZEE - Programa de Avaliação d