TRD 05: Data Presentation techniques (Mapping) Quantum GIS ...
TRD 05: Data Presentation techniques (Mapping) Quantum GIS ...
TRD 05: Data Presentation techniques (Mapping) Quantum GIS ...

You also want an ePaper? Increase the reach of your titles
YUMPU automatically turns print PDFs into web optimized ePapers that Google loves.
2.1 Why is all this so new?<br />
2.1. Why is all this so new?<br />
Well, it’s not. There are many new hardware devices that are enabling mobile geospatial services.<br />
Many open source geospatial applications are also available, but the existence of geospatially<br />
focused hardware and software is nothing new. Global positioning system (GPS) receivers are<br />
becoming commonplace, but have been used in various industries for more than a decade. Likewise,<br />
desktop mapping and analysis tools have also been a major commercial market, primarily focused<br />
on industries such as natural resource management.<br />
What is new, is how the latest hardware and software is being applied and who is applying it.<br />
Traditional users of mapping and analysis tools were highly trained <strong>GIS</strong> Analysts or digital mapping<br />
technicians trained to use CAD-like tools. Now, the processing capabilities of home PC’s and open<br />
source software packages have enabled an army of hobbyists, professionals, web developers, etc. to<br />
interact with geospatial data. The learning curve has come down. The costs have come down. The<br />
amount of geospatial technology saturation has increased.<br />
How is geospatial data stored? In a nutshell, there are two types of geospatial data in widespread<br />
use today. This is in additional to traditional tabular data that is also widely used by geospatial<br />
applications.<br />
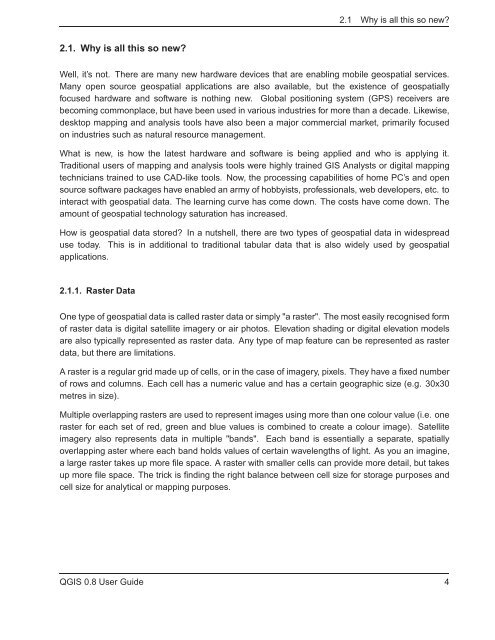
2.1.1. Raster <strong>Data</strong><br />
One type of geospatial data is called raster data or simply "a raster". The most easily recognised form<br />
of raster data is digital satellite imagery or air photos. Elevation shading or digital elevation models<br />
are also typically represented as raster data. Any type of map feature can be represented as raster<br />
data, but there are limitations.<br />
A raster is a regular grid made up of cells, or in the case of imagery, pixels. They have a fixed number<br />
of rows and columns. Each cell has a numeric value and has a certain geographic size (e.g. 30x30<br />
metres in size).<br />
Multiple overlapping rasters are used to represent images using more than one colour value (i.e. one<br />
raster for each set of red, green and blue values is combined to create a colour image). Satellite<br />
imagery also represents data in multiple "bands". Each band is essentially a separate, spatially<br />
overlapping aster where each band holds values of certain wavelengths of light. As you an imagine,<br />
a large raster takes up more file space. A raster with smaller cells can provide more detail, but takes<br />
up more file space. The trick is finding the right balance between cell size for storage purposes and<br />
cell size for analytical or mapping purposes.<br />
Q<strong>GIS</strong> 0.8 User Guide 4