TRD 05: Data Presentation techniques (Mapping) Quantum GIS ...
TRD 05: Data Presentation techniques (Mapping) Quantum GIS ...
TRD 05: Data Presentation techniques (Mapping) Quantum GIS ...
Create successful ePaper yourself
Turn your PDF publications into a flip-book with our unique Google optimized e-Paper software.
5.4 Raster Properties<br />
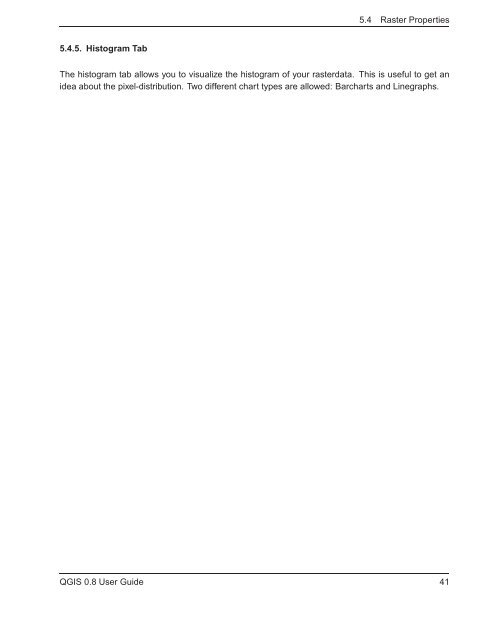
5.4.5. Histogram Tab<br />
The histogram tab allows you to visualize the histogram of your rasterdata. This is useful to get an<br />
idea about the pixel-distribution. Two different chart types are allowed: Barcharts and Linegraphs.<br />
Q<strong>GIS</strong> 0.8 User Guide 41


