TRD 05: Data Presentation techniques (Mapping) Quantum GIS ...
TRD 05: Data Presentation techniques (Mapping) Quantum GIS ...
TRD 05: Data Presentation techniques (Mapping) Quantum GIS ...

Create successful ePaper yourself
Turn your PDF publications into a flip-book with our unique Google optimized e-Paper software.
8.4 Digitizing and Editing Tools<br />
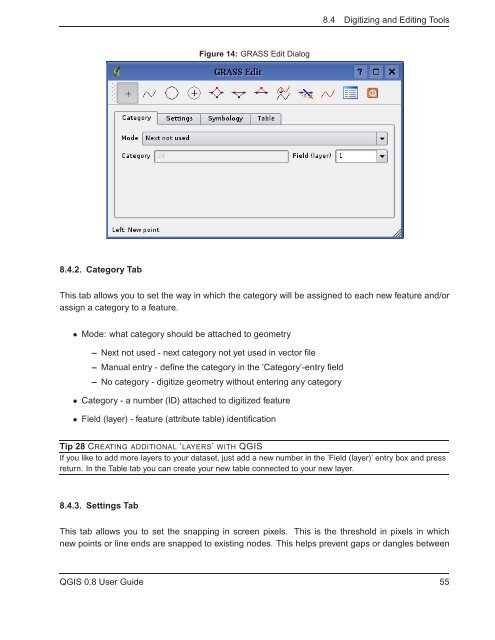
Figure 14: GRASS Edit Dialog<br />
8.4.2. Category Tab<br />
This tab allows you to set the way in which the category will be assigned to each new feature and/or<br />
assign a category to a feature.<br />
• Mode: what category should be attached to geometry<br />
– Next not used - next category not yet used in vector file<br />
– Manual entry - define the category in the ’Category’-entry field<br />
– No category - digitize geometry without entering any category<br />
• Category - a number (ID) attached to digitized feature<br />
• Field (layer) - feature (attribute table) identification<br />
Tip 28 CREATING ADDITIONAL ’LAYERS’ WITH Q<strong>GIS</strong><br />
If you like to add more layers to your dataset, just add a new number in the ’Field (layer)’ entry box and press<br />
return. In the Table tab you can create your new table connected to your new layer.<br />
8.4.3. Settings Tab<br />
This tab allows you to set the snapping in screen pixels. This is the threshold in pixels in which<br />
new points or line ends are snapped to existing nodes. This helps prevent gaps or dangles between<br />
Q<strong>GIS</strong> 0.8 User Guide 55