TRD 05: Data Presentation techniques (Mapping) Quantum GIS ...
TRD 05: Data Presentation techniques (Mapping) Quantum GIS ...
TRD 05: Data Presentation techniques (Mapping) Quantum GIS ...

You also want an ePaper? Increase the reach of your titles
YUMPU automatically turns print PDFs into web optimized ePapers that Google loves.
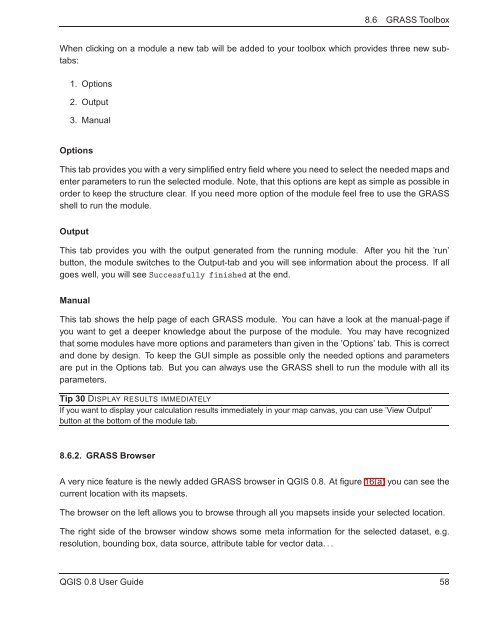
8.6 GRASS Toolbox<br />
When clicking on a module a new tab will be added to your toolbox which provides three new subtabs:<br />
1. Options<br />
2. Output<br />
3. Manual<br />
Options<br />
This tab provides you with a very simplified entry field where you need to select the needed maps and<br />
enter parameters to run the selected module. Note, that this options are kept as simple as possible in<br />
order to keep the structure clear. If you need more option of the module feel free to use the GRASS<br />
shell to run the module.<br />
Output<br />
This tab provides you with the output generated from the running module. After you hit the ’run’<br />
button, the module switches to the Output-tab and you will see information about the process. If all<br />
goes well, you will see Successfully finished at the end.<br />
Manual<br />
This tab shows the help page of each GRASS module. You can have a look at the manual-page if<br />
you want to get a deeper knowledge about the purpose of the module. You may have recognized<br />
that some modules have more options and parameters than given in the ’Options’ tab. This is correct<br />
and done by design. To keep the GUI simple as possible only the needed options and parameters<br />
are put in the Options tab. But you can always use the GRASS shell to run the module with all its<br />
parameters.<br />
Tip 30 DISPLAY RESULTS IMMEDIATELY<br />
If you want to display your calculation results immediately in your map canvas, you can use ’View Output’<br />
button at the bottom of the module tab.<br />
8.6.2. GRASS Browser<br />
A very nice feature is the newly added GRASS browser in Q<strong>GIS</strong> 0.8. At figure 16(a) you can see the<br />
current location with its mapsets.<br />
The browser on the left allows you to browse through all you mapsets inside your selected location.<br />
The right side of the browser window shows some meta information for the selected dataset, e.g.<br />
resolution, bounding box, data source, attribute table for vector data. . .<br />
Q<strong>GIS</strong> 0.8 User Guide 58