TRD 05: Data Presentation techniques (Mapping) Quantum GIS ...
TRD 05: Data Presentation techniques (Mapping) Quantum GIS ...
TRD 05: Data Presentation techniques (Mapping) Quantum GIS ...

Create successful ePaper yourself
Turn your PDF publications into a flip-book with our unique Google optimized e-Paper software.
4.3 The Vector Properties Dialog<br />
Graduated symbol - objects within the layer are displayed with different symbols classified by the<br />
values of a particular field.<br />
Continuous colour - objects within the layer are displayed with a spread of colours classified by the<br />
numerical values within a specified field.<br />
Unique value - objects are classified by the unique values within a specified field with each value<br />
having a different symbol.<br />
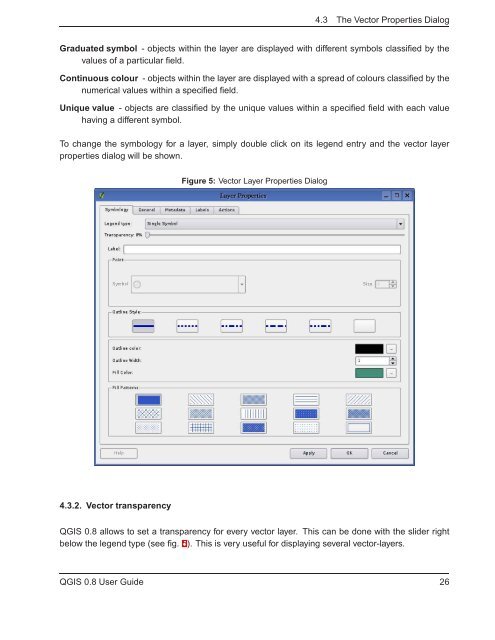
To change the symbology for a layer, simply double click on its legend entry and the vector layer<br />
properties dialog will be shown.<br />
Figure 5: Vector Layer Properties Dialog<br />
4.3.2. Vector transparency<br />
Q<strong>GIS</strong> 0.8 allows to set a transparency for every vector layer. This can be done with the slider right<br />
below the legend type (see fig. 5). This is very useful for displaying several vector-layers.<br />
Q<strong>GIS</strong> 0.8 User Guide 26