TRD 05: Data Presentation techniques (Mapping) Quantum GIS ...
TRD 05: Data Presentation techniques (Mapping) Quantum GIS ...
TRD 05: Data Presentation techniques (Mapping) Quantum GIS ...

Create successful ePaper yourself
Turn your PDF publications into a flip-book with our unique Google optimized e-Paper software.
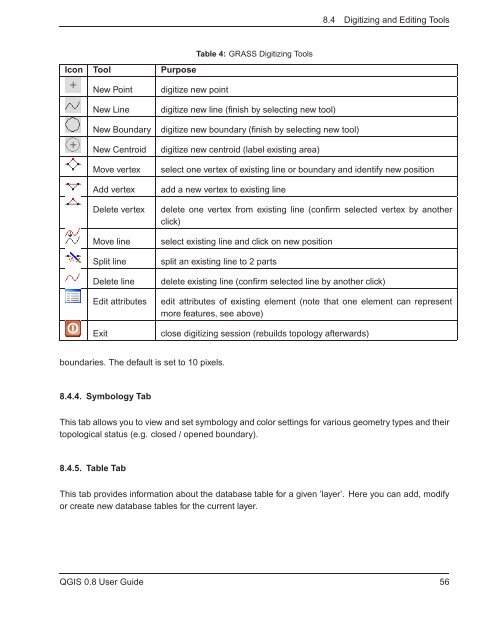
8.4 Digitizing and Editing Tools<br />
Icon Tool Purpose<br />
Table 4: GRASS Digitizing Tools<br />
New Point<br />
New Line<br />
New Boundary<br />
New Centroid<br />
Move vertex<br />
Add vertex<br />
Delete vertex<br />
Move line<br />
Split line<br />
Delete line<br />
Edit attributes<br />
Exit<br />
digitize new point<br />
digitize new line (finish by selecting new tool)<br />
digitize new boundary (finish by selecting new tool)<br />
digitize new centroid (label existing area)<br />
select one vertex of existing line or boundary and identify new position<br />
add a new vertex to existing line<br />
delete one vertex from existing line (confirm selected vertex by another<br />
click)<br />
select existing line and click on new position<br />
split an existing line to 2 parts<br />
delete existing line (confirm selected line by another click)<br />
edit attributes of existing element (note that one element can represent<br />
more features, see above)<br />
close digitizing session (rebuilds topology afterwards)<br />
boundaries. The default is set to 10 pixels.<br />
8.4.4. Symbology Tab<br />
This tab allows you to view and set symbology and color settings for various geometry types and their<br />
topological status (e.g. closed / opened boundary).<br />
8.4.5. Table Tab<br />
This tab provides information about the database table for a given ’layer’. Here you can add, modify<br />
or create new database tables for the current layer.<br />
Q<strong>GIS</strong> 0.8 User Guide 56