TRD 05: Data Presentation techniques (Mapping) Quantum GIS ...
TRD 05: Data Presentation techniques (Mapping) Quantum GIS ...
TRD 05: Data Presentation techniques (Mapping) Quantum GIS ...

You also want an ePaper? Increase the reach of your titles
YUMPU automatically turns print PDFs into web optimized ePapers that Google loves.
3.4 Q<strong>GIS</strong> GUI<br />
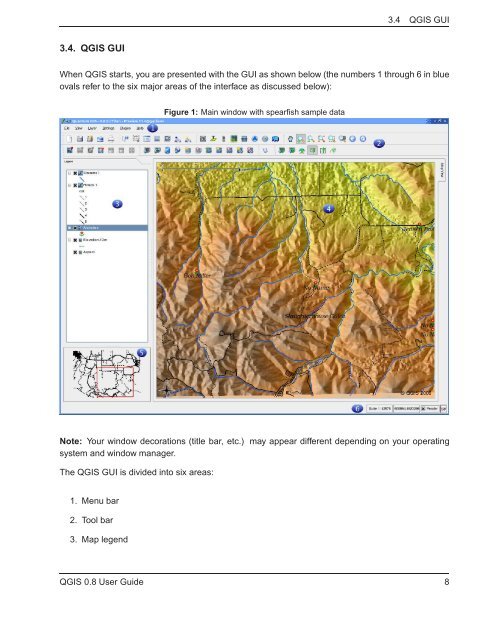
3.4. Q<strong>GIS</strong> GUI<br />
When Q<strong>GIS</strong> starts, you are presented with the GUI as shown below (the numbers 1 through 6 in blue<br />
ovals refer to the six major areas of the interface as discussed below):<br />
Figure 1: Main window with spearfish sample data<br />
Note: Your window decorations (title bar, etc.) may appear different depending on your operating<br />
system and window manager.<br />
The Q<strong>GIS</strong> GUI is divided into six areas:<br />
1. Menu bar<br />
2. Tool bar<br />
3. Map legend<br />
Q<strong>GIS</strong> 0.8 User Guide 8