chapter viii wool & wollen textiles industry - Ministry of Textiles
chapter viii wool & wollen textiles industry - Ministry of Textiles
chapter viii wool & wollen textiles industry - Ministry of Textiles

Create successful ePaper yourself
Turn your PDF publications into a flip-book with our unique Google optimized e-Paper software.
annual report 2011-12<br />
CHAPTER- XVI<br />
TEXTILES IN NORTH EASTERN REGION<br />
HANDLOOM<br />
North Eastern Region has<br />
the highest concentration <strong>of</strong><br />
Handlooms in the country. In the<br />
North East, 90% <strong>of</strong> the handloom weavers<br />
households are weaver households.<br />
The allied worker households are mostly<br />
found in the states outside the region,<br />
and form 29% <strong>of</strong> the total handloom<br />
worker households in these States. The<br />
North Eastern States have predominantly<br />
female (99%) adult work force.<br />
The Weavers’ Service Centres, set up at<br />
Guwahati, Agartala and Imphal function<br />
as the Nodal Centre for development <strong>of</strong><br />
designs and dissemination <strong>of</strong> information<br />
to the weavers in the region. The IIHT set<br />
up at Guwahati, caters to the requirements<br />
<strong>of</strong> the handloom sector for technically<br />
qualified manpower.<br />
Sl.<br />
No.<br />
Name <strong>of</strong> the<br />
State<br />
235<br />
A special dispensation has been made<br />
for the North Eastern States under the<br />
Integrated Handlooms Development<br />
Scheme. In respect <strong>of</strong> these States, the<br />
grant portion towards basic inputs <strong>of</strong> the<br />
scheme is shared between Centre, State<br />
Governments and the implementing<br />
agencies in the ratio <strong>of</strong> 90:5:5 respectively<br />
whereas for General States, it is in the<br />
ratio <strong>of</strong> 70:20:10 respectively.<br />
During 2010-11, 30 Clusters were<br />
sanctioned in the NER and a sum <strong>of</strong><br />
Rs.19.47 crore was released, which also<br />
includes second installment <strong>of</strong> earlier<br />
sanctioned projects. In addition, 257<br />
Group Approach Projects were sanctioned<br />
and a sum <strong>of</strong> Rs.8.18 crore was released,<br />
which also includes second installment <strong>of</strong><br />
earlier sanctioned projects. Physical and<br />
Financial progress in NER during 2009-<br />
10 to 2011-12 (upto December 2011) is<br />
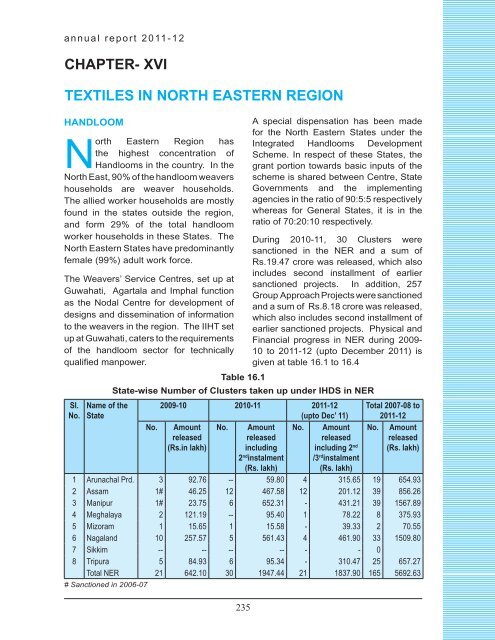
given at table 16.1 to 16.4<br />
Table 16.1<br />
State-wise Number <strong>of</strong> Clusters taken up under IHDS in NER<br />
2009-10 2010-11 2011-12<br />
(upto Dec’ 11)<br />
No. Amount No.<br />
No.<br />
released<br />
(Rs.in lakh)<br />
Amount<br />
released<br />
including<br />
2 nd instalment<br />
(Rs. lakh)<br />
Amount<br />
released<br />
including 2 nd<br />
/3 rd instalment<br />
(Rs. lakh)<br />
Total 2007-08 to<br />
2011-12<br />
No. Amount<br />
released<br />
(Rs. lakh)<br />
1 Arunachal Prd. 3 92.76 -- 59.80 4 315.65 19 654.93<br />
2 Assam 1# 46.25 12 467.58 12 201.12 39 856.26<br />
3 Manipur 1# 23.75 6 652.31 - 431.21 39 1567.89<br />
4 Meghalaya 2 121.19 -- 95.40 1 78.22 8 375.93<br />
5 Mizoram 1 15.65 1 15.58 - 39.33 2 70.55<br />
6 Nagaland 10 257.57 5 561.43 4 461.90 33 1509.80<br />
7 Sikkim -- -- -- -- - - 0<br />
8 Tripura 5 84.93 6 95.34 - 310.47 25 657.27<br />
Total NER 21 642.10 30 1947.44 21 1837.90 165 5 6 9 2 . 6 3<br />
# Sanctioned in 2006-07