chapter viii wool & wollen textiles industry - Ministry of Textiles
chapter viii wool & wollen textiles industry - Ministry of Textiles
chapter viii wool & wollen textiles industry - Ministry of Textiles

You also want an ePaper? Increase the reach of your titles
YUMPU automatically turns print PDFs into web optimized ePapers that Google loves.
annual report 2011-12<br />
CHAPTER III<br />
THE ORGANIZED TEXTILES MILL INDUSTRY<br />
The Cotton / Man-made fibre textile<br />
<strong>industry</strong> is the largest organized<br />
<strong>industry</strong> in the country in terms <strong>of</strong><br />
employment (nearly 1 million workers) and<br />
number <strong>of</strong> units. Besides, there are a large<br />
number <strong>of</strong> subsidiary industries dependent<br />
on this sector, such as those manufacturing<br />
machinery, accessories, stores, ancillaries,<br />
dyes & chemicals. As on 30.11.2011,<br />
there were 1946 cotton/man-made fibre<br />
textile mills (non-SSI) in the country with an<br />
installed capacity <strong>of</strong> 43.13 million spindles<br />
5,20,000 rotors and 52,000 looms.<br />
Textile production covering man-made<br />
fibre, man-made filament yarn and<br />
cotton yarn is showing a decreasing<br />
trend. Blended and 100% non cotton<br />
yarn production recorded an increase<br />
<strong>of</strong> 5.2% during 2011-12 (April – October<br />
2011). The production <strong>of</strong> spun yarn<br />
during April-Oct. (2011-12) has shown<br />
a decrease <strong>of</strong> 8.1%. The production<br />
<strong>of</strong> cotton yarn during 2011-12 (April-<br />
Oct.) recorded a decrease <strong>of</strong> 12.7%<br />
(Provisional).<br />
Cloth production by mill sector showed<br />
marginal increase <strong>of</strong> 4.6% during<br />
April-Oct. (2011-12) (provisional). During<br />
the same period cloth production by<br />
power loom and hosiery sector showed a<br />
decrease <strong>of</strong> 4.4% and 17.8% respectively.<br />
However the cloth production in handloom<br />
sector showed an increase <strong>of</strong> 3%.<br />
CAPACITY<br />
There were 1946 cotton/man-made fibre<br />
textile mills (non-SSI) in the country with<br />
an installed capacity <strong>of</strong> 43.13 million<br />
spindles 5,20,000 rotors and 52,000<br />
looms as on 30.11.2011.<br />
CAPACITY UTILISATION IN THE<br />
MILL SECTOR<br />
The capacity utilization in the spinning<br />
sector <strong>of</strong> the organized textile mill <strong>industry</strong><br />
ranged between 80 to 90 % while the<br />
capacity utilization in the weaving sector <strong>of</strong><br />
the organized textile mill <strong>industry</strong> ranged<br />
between 41 to 62 %.<br />
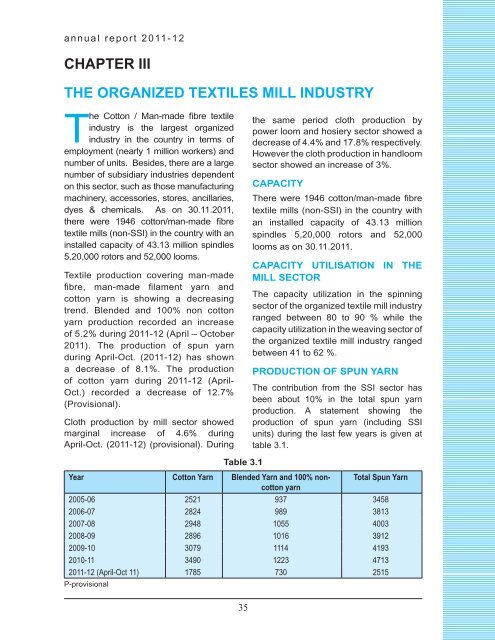
PRODUCTION OF SPUN YARN<br />
The contribution from the SSI sector has<br />
been about 10% in the total spun yarn<br />
production. A statement showing the<br />
production <strong>of</strong> spun yarn (including SSI<br />
units) during the last few years is given at<br />
table 3.1.<br />
Table 3.1<br />
Year Cotton Yarn Blended Yarn and 100% noncotton<br />
Total Spun Yarn<br />
yarn<br />
2005-06 2521 937 3458<br />
2006-07 2824 989 3813<br />
2007-08 2948 1055 4003<br />
2008-09 2896 1016 3912<br />
2009-10 3079 1114 4193<br />
2010-11 3490 1223 4713<br />
2011-12 (April-Oct 11) 1785 730 2515<br />
P-provisional<br />
35