chapter viii wool & wollen textiles industry - Ministry of Textiles
chapter viii wool & wollen textiles industry - Ministry of Textiles
chapter viii wool & wollen textiles industry - Ministry of Textiles

You also want an ePaper? Increase the reach of your titles
YUMPU automatically turns print PDFs into web optimized ePapers that Google loves.
ministry <strong>of</strong> <strong>textiles</strong><br />
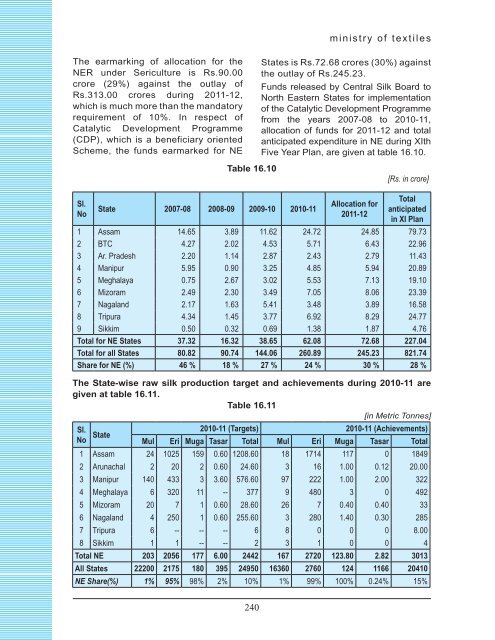
The earmarking <strong>of</strong> allocation for the<br />
NER under Sericulture is Rs.90.00<br />
crore (29%) against the outlay <strong>of</strong><br />
Rs.313.00 crores during 2011-12,<br />
which is much more than the mandatory<br />
requirement <strong>of</strong> 10%. In respect <strong>of</strong><br />
Catalytic Development Programme<br />
(CDP), which is a beneficiary oriented<br />
Scheme, the funds earmarked for NE<br />
States is Rs.72.68 crores (30%) against<br />
the outlay <strong>of</strong> Rs.245.23.<br />
Funds released by Central Silk Board to<br />
North Eastern States for implementation<br />
<strong>of</strong> the Catalytic Development Programme<br />
from the years 2007-08 to 2010-11,<br />
allocation <strong>of</strong> funds for 2011-12 and total<br />
anticipated expenditure in NE during XIth<br />
Five Year Plan, are given at table 16.10.<br />
Table 16.10<br />
[Rs. in crore]<br />
Sl.<br />
No<br />
State 2007-08 2008-09 2009-10 2010-11<br />
Allocation for<br />
2011-12<br />
Total<br />
anticipated<br />
in XI Plan<br />
1 Assam 14.65 3.89 11.62 24.72 24.85 79.73<br />
2 BTC 4.27 2.02 4.53 5.71 6.43 22.96<br />
3 Ar. Pradesh 2.20 1.14 2.87 2.43 2.79 11.43<br />
4 Manipur 5.95 0.90 3.25 4.85 5.94 20.89<br />
5 Meghalaya 0.75 2.67 3.02 5.53 7.13 19.10<br />
6 Mizoram 2.49 2.30 3.49 7.05 8.06 23.39<br />
7 Nagaland 2.17 1.63 5.41 3.48 3.89 16.58<br />
8 Tripura 4.34 1.45 3.77 6.92 8.29 24.77<br />
9 Sikkim 0.50 0.32 0.69 1.38 1.87 4.76<br />
Total for NE States 37.32 16.32 38.65 62.08 72.68 227.04<br />
Total for all States 80.82 90.74 144.06 260.89 245.23 821.74<br />
Share for NE (%) 46 % 18 % 27 % 24 % 30 % 28 %<br />
The State-wise raw silk production target and achievements during 2010-11 are<br />
given at table 16.11.<br />
Table 16.11<br />
[in Metric Tonnes]<br />
Sl.<br />
No State 2010-11 (Targets) 2010-11 (Achievements)<br />
Mul Eri Muga Tasar Total Mul Eri Muga Tasar Total<br />
1 Assam 24 1025 159 0.60 1208.60 18 1714 117 0 1849<br />
2 Arunachal 2 20 2 0.60 24.60 3 16 1.00 0.12 20.00<br />
3 Manipur 140 433 3 3.60 576.60 97 222 1.00 2.00 322<br />
4 Meghalaya 6 320 11 -- 377 9 480 3 0 492<br />
5 Mizoram 20 7 1 0.60 28.60 26 7 0.40 0.40 33<br />
6 Nagaland 4 250 1 0.60 255.60 3 280 1.40 0.30 285<br />
7 Tripura 6 -- -- -- 6 8 0 0 0 8.00<br />
8 Sikkim 1 1 -- -- 2 3 1 0 0 4<br />
Total NE 203 2056 177 6.00 2442 167 2720 123.80 2.82 3013<br />
All States 22200 2175 180 395 24950 16360 2760 124 1166 20410<br />
NE Share(%) 1% 95% 98% 2% 10% 1% 99% 100% 0.24% 15%<br />
240