chapter viii wool & wollen textiles industry - Ministry of Textiles
chapter viii wool & wollen textiles industry - Ministry of Textiles
chapter viii wool & wollen textiles industry - Ministry of Textiles

You also want an ePaper? Increase the reach of your titles
YUMPU automatically turns print PDFs into web optimized ePapers that Google loves.
ministry <strong>of</strong> <strong>textiles</strong><br />
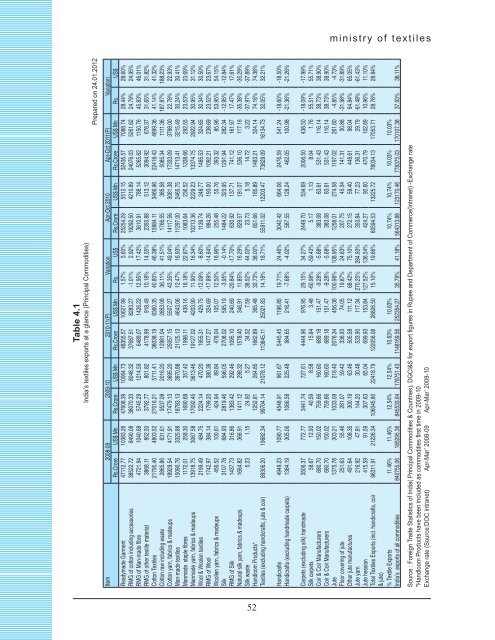
Table 4.1<br />
India’s <strong>textiles</strong> exports at a glance (Principal Commodities)<br />
Prepared on 24.01.2012<br />
Item 2008-09 2009-10 2010-11(P) Variation Apr-Oct 2010 Apr-Oct 2011(P) Variation<br />
Rs.Crore US$ Mn Rs.Crore US$ Mn Rs.Crore US$ Mn Rs. US$ Rs.Crore US$ Mn Rs.Crore US$ Mn Rs. US$<br />
Readymade Garment 47112.77 10383.26 47608.39 10064.73 48355.57 10627.99 1.57% 5.60% 25254.29 5512.15 32436.57 7088.74 28.44% 28.60%<br />
RMG <strong>of</strong> cotton including accessories 38522.72 8490.08 38070.33 8048.32 37687.51 8283.27 -1.01% 2.92% 19292.50 4210.89 24076.03 5261.62 24.79% 24.95%<br />
RMG <strong>of</strong> Man-made fibre 4721.94 1040.68 5745.29 1214.59 6489.07 1426.22 12.95% 17.42% 3610.91 788.14 5265.62 1150.76 45.83% 46.01%<br />
RMG <strong>of</strong> other textile material 3868.11 852.50 3792.77 801.82 4178.99 918.49 10.18% 14.55% 2350.88 513.12 3094.92 676.37 31.65% 31.82%<br />
Cotton <strong>Textiles</strong> 21795.40 4803.52 27016.21 5711.41 38038.19 8360.35 40.80% 46.38% 15884.11 3466.96 22418.43 4899.36 41.14% 41.32%<br />
Cotton raw including waste 2865.86 631.61 9537.08 2016.20 12981.04 2853.08 36.11% 41.51% 1766.55 385.58 5085.34 1111.36 187.87% 188.23%<br />
Cotton yarn, fabrics & madeups 18929.54 4171.91 17479.13 3695.20 25057.15 5507.27 43.35% 49.04% 14117.56 3081.38 17333.09 3788.00 22.78% 22.93%<br />
Man-made <strong>textiles</strong> 15090.76 3325.88 18783.13 3970.88 21125.13 4643.06 12.47% 16.93% 11297.00 2465.75 14713.41 3215.49 30.24% 30.41%<br />
Manmade staple fibres 1172.01 258.30 1690.68 357.42 1998.11 439.16 18.18% 22.87% 1083.64 236.52 1338.66 292.55 23.53% 23.69%<br />
Manmade yarn, fabrics & madeups 13918.75 3067.58 17092.45 3613.46 19127.02 4203.90 11.90% 16.34% 10213.36 2229.23 13374.75 2922.94 30.95% 31.12%<br />
Wool & Woolen <strong>textiles</strong> 2199.49 484.75 2224.14 470.20 1955.31 429.75 -12.09% -8.60% 1139.74 248.77 1485.53 324.65 30.34% 30.50%<br />
RMG <strong>of</strong> Wool 1742.97 384.14 1799.20 380.36 1477.27 324.69 -17.89% -14.64% 884.26 193.00 1092.21 238.69 23.52% 23.67%<br />
Woollen yarn, fabrics & madeups 456.52 100.61 424.94 89.84 478.04 105.07 12.50% 16.96% 255.48 55.76 393.32 85.96 53.95% 54.15%<br />
Silk 3107.78 684.93 2819.46 596.05 2708.02 595.19 -3.95% -0.14% 1484.22 323.95 1291.94 282.34 -12.95% -12.84%<br />
RMG <strong>of</strong> Silk 1437.73 316.86 1383.42 292.46 1095.10 240.69 -20.84% -17.70% 630.92 137.71 741.12 161.97 17.47% 17.61%<br />
Natural silk yarn, fabrics & madeups 1664.82 366.91 1411.12 298.32 1578.40 346.91 11.85% 16.29% 829.57 181.07 536.10 117.16 -35.38% -35.29%<br />
Silk waste 5.23 1.15 24.92 5.27 34.52 7.59 38.52% 44.02% 23.73 5.18 14.72 3.22 -37.97% -37.89%<br />
Handloom Products* 1252.81 264.85 1662.89 365.48 32.73% 38.00% 851.66 185.89 1483.21 324.14 74.16% 74.38%<br />
<strong>Textiles</strong> (excluding handicrafts, jute & coir) 89306.20 19682.34 99704.14 21078.12 113845.11 25021.83 14.18% 18.71% 55911.02 12203.47 73829.09 16134.73 32.05% 32.21%<br />
Handicrafts 4949.23 1090.77 4548.91 961.67 5445.45 1196.85 19.71% 24.46% 3042.42 664.06 2476.59 541.24 -18.60% -18.50%<br />
Handicrafts (excluding handmade carpets) 1384.19 305.06 1066.58 225.48 984.65 216.41 -7.68% -4.02% 587.55 128.24 462.05 100.98 -21.36% -21.26%<br />
Carpets (excluding silk) handmade 3506.37 772.77 3441.74 727.61 4444.96 976.95 29.15% 34.27% 2449.70 534.69 2006.50 438.50 -18.09% -17.99%<br />
Silk carpets 58.67 12.93 40.59 8.58 15.84 3.48 -60.98% -59.43% 5.17 1.13 8.04 1.76 55.51% 55.71%<br />
Coir & Coir Manufacturers 680.70 150.02 759.66 160.60 689.18 151.47 -9.28% -5.68% 383.08 83.61 531.43 116.14 38.73% 38.90%<br />
Coir & Coir Manufacturers 680.70 150.02 759.66 160.60 689.18 151.47 -9.28% -5.68% 383.08 83.61 531.43 116.14 38.73% 38.90%<br />
Jute 1375.78 303.21 1033.09 218.40 2076.34 456.36 100.98% 108.95% 1258.01 274.58 1197.02 261.60 -4.85% -4.73%<br />
Floor covering <strong>of</strong> jute 251.63 55.46 281.07 59.42 336.93 74.05 19.87% 24.63% 207.75 45.34 141.31 30.88 -31.98% -31.89%<br />
Other jute manufactures 491.64 108.35 300.19 63.46 505.58 111.12 68.42% 75.10% 272.15 59.40 448.61 98.04 64.84% 65.05%<br />
Jute yarn 216.92 47.81 144.20 30.48 533.90 117.34 270.25% 284.93% 353.84 77.23 136.31 29.79 -61.48% -61.43%<br />
Jute hessian 415.59 91.59 307.63 65.04 699.93 153.84 127.52% 136.54% 424.27 92.60 470.79 102.89 10.96% 11.10%<br />
Total <strong>Textiles</strong> Exports (incl. handicrafts, coir<br />
& jute)<br />
96311.91 21226.34 106045.80 22418.79 122056.08 26826.50 15.10% 19.66% 60594.53 13225.72 78034.13 17053.71 28.78% 28.94%<br />
% Textile Exports 11.46% 11.46% 12.54% 12.54% 10.63% 10.63% 10.74% 10.74% 10.03% 10.03%<br />
India’s exports <strong>of</strong> all commodities 840755.06 185295.36 845533.64 178751.43 1148169.56 252354.27 35.79% 41.18% 564313.88 123170.46 778375.03 170107.38 37.93% 38.11%<br />
Source : Foreign Trade Statistics <strong>of</strong> India( Principal Commodities & Countries), DGCI&S for export figures in Rupee and Department <strong>of</strong> Commerce(Intranet) -Exchange rate<br />
*Handloom Products have been included as commodities first time in 2009-10<br />
Exchange rate (Source:DOC intranet) Apr-Mar’ 2008-09 Apr-Mar’ 2009-10<br />
52