- Page 2 and 3:
annual report 2011-12 Annual Report
- Page 4 and 5:
annual report 2011-12 CONTENTS Sl.N
- Page 6 and 7:
annual report 2011-12 CHAPTER I HIG
- Page 8 and 9:
annual report 2011-12 CHAPTER I HIG
- Page 10 and 11:
annual report 2011-12 Industry Sect
- Page 12 and 13:
annual report 2011-12 another regis
- Page 14 and 15:
annual report 2011-12 (d) Group D -
- Page 16 and 17:
annual report 2011-12 Garmenting Tr
- Page 18 and 19:
annual report 2011-12 with a vintag
- Page 20 and 21:
annual report 2011-12 extension sup
- Page 22 and 23:
annual report 2011-12 units stood a
- Page 24 and 25: annual report 2011-12 Supply of yar
- Page 26 and 27: annual report 2011-12 it has associ
- Page 28 and 29: annual report 2011-12 CHAPTER II FU
- Page 30 and 31: annual report 2011-12 CHAPTER-II FU
- Page 32 and 33: annual report 2011-12 Development C
- Page 34 and 35: annual report 2011-12 Inspectorate
- Page 36 and 37: annual report 2011-12 Table 2.2 LIS
- Page 38 and 39: annual report 2011-12 CHAPTER III T
- Page 40 and 41: annual report 2011-12 CHAPTER III T
- Page 42 and 43: annual report 2011-12 MILL SECTOR T
- Page 44 and 45: annual report 2011-12 Table 3.4 Per
- Page 46 and 47: annual report 2011-12 cost subject
- Page 48 and 49: annual report 2011-12 Sr. No. Year
- Page 50 and 51: annual report 2011-12 PROCESSING SE
- Page 52 and 53: annual report 2011-12 Four COEs hav
- Page 54 and 55: annual report 2011-12 CHAPTER IV EX
- Page 56 and 57: annual report 2011-12 CHAPTER IV EX
- Page 58 and 59: annual report 2011-12 of India’s
- Page 60 and 61: annual report 2011-12 a growth of 1
- Page 62 and 63: annual report 2011-12 CHAPTER V COT
- Page 64 and 65: annual report 2011-12 CHAPTER V COT
- Page 66 and 67: annual report 2011-12 cotton in ter
- Page 68 and 69: annual report 2011-12 CHAPTER VI TH
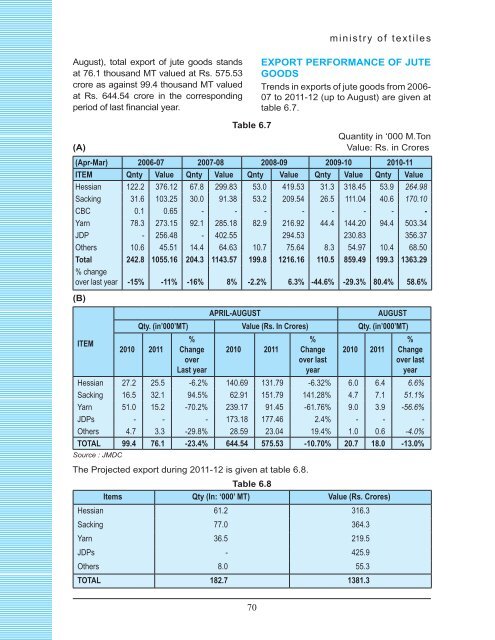
- Page 70 and 71: annual report 2011-12 CHAPTER-VI TH
- Page 72 and 73: annual report 2011-12 ● ● ●
- Page 76 and 77: annual report 2011-12 The value of
- Page 78 and 79: annual report 2011-12 Table 6.11 FI
- Page 80 and 81: annual report 2011-12 Table 6.16 Rs
- Page 82 and 83: annual report 2011-12 STATUS OF IMP
- Page 84 and 85: annual report 2011-12 sections of t
- Page 86 and 87: annual report 2011-12 Each of the s
- Page 88 and 89: annual report 2011-12 Social audit
- Page 90 and 91: annual report 2011-12 CHAPTER VII S
- Page 92 and 93: annual report 2011-12 CHAPTER VII S
- Page 94 and 95: annual report 2011-12 Sl. No. Parti
- Page 96 and 97: annual report 2011-12 Sl. No. Table
- Page 98 and 99: annual report 2011-12 the Afro-Asia
- Page 100 and 101: annual report 2011-12 (17.37%) and
- Page 102 and 103: annual report 2011-12 for sericultu
- Page 104 and 105: annual report 2011-12 CHAPTER VIII
- Page 106 and 107: annual report 2011-12 CHAPTER VIII
- Page 108 and 109: annual report 2011-12 - Establishme
- Page 110 and 111: annual report 2011-12 CHAPTER IX DE
- Page 112 and 113: annual report 2011-12 CHAPTER IX DE
- Page 114 and 115: annual report 2011-12 Component Nat
- Page 116 and 117: annual report 2011-12 All India Pow
- Page 118 and 119: annual report 2011-12 CHAPTER X HAN
- Page 120 and 121: annual report 2011-12 CHAPTER X HAN
- Page 122 and 123: annual report 2011-12 The Office of
- Page 124 and 125:
annual report 2011-12 Table 10.4 Nu
- Page 126 and 127:
annual report 2011-12 Table 10.6. E
- Page 128 and 129:
annual report 2011-12 Havelies, (iv
- Page 130 and 131:
annual report 2011-12 sector. There
- Page 132 and 133:
annual report 2011-12 Weavers’ Se
- Page 134 and 135:
annual report 2011-12 guarantee fee
- Page 136 and 137:
annual report 2011-12 IMPLEMENTATIO
- Page 138 and 139:
annual report 2011-12 Table 10.12 P
- Page 140 and 141:
annual report 2011-12 2011. Also a
- Page 142 and 143:
annual report 2011-12 1. Disseminat
- Page 144 and 145:
annual report 2011-12 CHAPTER XI HA
- Page 146 and 147:
annual report 2011-12 CHAPTER XI HA
- Page 148 and 149:
annual report 2011-12 First Tableau
- Page 150 and 151:
annual report 2011-12 iii) Publicit
- Page 152 and 153:
annual report 2011-12 ● ● ●
- Page 154 and 155:
annual report 2011-12 ● Tendence,
- Page 156 and 157:
annual report 2011-12 ACHIEVEMENTS
- Page 158 and 159:
annual report 2011-12 View of India
- Page 160 and 161:
annual report 2011-12 ● ● ● O
- Page 162 and 163:
annual report 2011-12 This is a new
- Page 164 and 165:
annual report 2011-12 v The equipme
- Page 166 and 167:
annual report 2011-12 = Workshop/Se
- Page 168 and 169:
annual report 2011-12 = to increase
- Page 170 and 171:
annual report 2011-12 CHAPTER XII C
- Page 172 and 173:
annual report 2011-12 CHAPTER XII C
- Page 174 and 175:
annual report 2011-12 Ahmedabad, by
- Page 176 and 177:
annual report 2011-12 Table12.3 TUR
- Page 178 and 179:
annual report 2011-12 Table 12.4 (R
- Page 180 and 181:
annual report 2011-12 Table 12.7 Th
- Page 182 and 183:
annual report 2011-12 1. Raising of
- Page 184 and 185:
annual report 2011-12 RBHM Jute Mil
- Page 186 and 187:
annual report 2011-12 is restarted
- Page 188 and 189:
annual report 2011-12 for textile m
- Page 190 and 191:
annual report 2011-12 products were
- Page 192 and 193:
annual report 2011-12 Ministry of T
- Page 194 and 195:
annual report 2011-12 the merchandi
- Page 196 and 197:
annual report 2011-12 CHAPTER XIII
- Page 198 and 199:
annual report 2011-12 CHAPTER XIII
- Page 200 and 201:
annual report 2011-12 MANTRA has be
- Page 202 and 203:
annual report 2011-12 A2LA Accredit
- Page 204 and 205:
annual report 2011-12 of nonwoven f
- Page 206 and 207:
annual report 2011-12 Regional Cent
- Page 208 and 209:
annual report 2011-12 Application N
- Page 210 and 211:
annual report 2011-12 Objectives :
- Page 212 and 213:
annual report 2011-12 the primary o
- Page 214 and 215:
annual report 2011-12 Sr. No. Table
- Page 216 and 217:
annual report 2011-12 Sr. No. Table
- Page 218 and 219:
annual report 2011-12 mark registra
- Page 220 and 221:
annual report 2011-12 + 20 in Manag
- Page 222 and 223:
annual report 2011-12 Sr. No. A Hea
- Page 224 and 225:
annual report 2011-12 CHAPTER XIV C
- Page 226 and 227:
annual report 2011-12 CHAPTER XIV C
- Page 228 and 229:
annual report 2011-12 S.No. Name of
- Page 230 and 231:
annual report 2011-12 Sl. Offices N
- Page 232 and 233:
annual report 2011-12 Each of these
- Page 234 and 235:
annual report 2011-12 CHAPTER XV WE
- Page 236 and 237:
annual report 2011-12 CHAPTER XV WE
- Page 238 and 239:
annual report 2011-12 CHAPTER- XVI
- Page 240 and 241:
annual report 2011-12 CHAPTER- XVI
- Page 242 and 243:
annual report 2011-12 State Table 1
- Page 244 and 245:
annual report 2011-12 SILK Sericult
- Page 246 and 247:
annual report 2011-12 The State-wis
- Page 248 and 249:
annual report 2011-12 = Advanced Tr
- Page 250 and 251:
annual report 2011-12 CHAPTER XVII
- Page 252 and 253:
annual report 2011-12 CHAPTER XVII
- Page 254 and 255:
annual report 2011-12 accordance wi
- Page 256 and 257:
annual report 2011-12 in streamlini
- Page 258 and 259:
annual report 2011-12 for the progr
- Page 260 and 261:
annual report 2011-12 CHAPTER XVIII
- Page 262 and 263:
annual report 2011-12 CHAPTER XVIII
- Page 264 and 265:
annual report 2011-12 CHAPTER XIX I
- Page 266 and 267:
annual report 2011-12 CHAPTER XIX I
- Page 268 and 269:
annual report 2011-12 CHAPTER XX VI
- Page 270 and 271:
annual report 2011-12 CHAPTER XX VI
- Page 272 and 273:
annual report 2011-12 CHAPTER XXI O
- Page 274 and 275:
annual report 2011-12 CHAPTER XXI O
- Page 276 and 277:
annual report 2011-12 CHAPTER XXII
- Page 278 and 279:
annual report 2011-12 CHAPTER XXII
- Page 280 and 281:
annual report 2011-12 CHAPTER-XXIII
- Page 282 and 283:
annual report 2011-12 CHAPTER-XXIII