chapter viii wool & wollen textiles industry - Ministry of Textiles
chapter viii wool & wollen textiles industry - Ministry of Textiles
chapter viii wool & wollen textiles industry - Ministry of Textiles

Create successful ePaper yourself
Turn your PDF publications into a flip-book with our unique Google optimized e-Paper software.
ministry <strong>of</strong> <strong>textiles</strong><br />
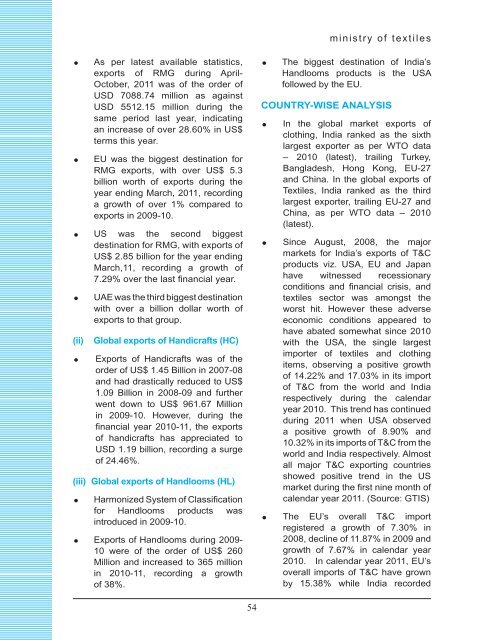
= As per latest available statistics,<br />
exports <strong>of</strong> RMG during April-<br />
October, 2011 was <strong>of</strong> the order <strong>of</strong><br />
USD 7088.74 million as against<br />
USD 5512.15 million during the<br />
same period last year, indicating<br />
an increase <strong>of</strong> over 28.60% in US$<br />
terms this year.<br />
= EU was the biggest destination for<br />
RMG exports, with over US$ 5.3<br />
billion worth <strong>of</strong> exports during the<br />
year ending March, 2011, recording<br />
a growth <strong>of</strong> over 1% compared to<br />
exports in 2009-10.<br />
= US was the second biggest<br />
destination for RMG, with exports <strong>of</strong><br />
US$ 2.85 billion for the year ending<br />
March,11, recording a growth <strong>of</strong><br />
7.29% over the last financial year.<br />
= UAE was the third biggest destination<br />
with over a billion dollar worth <strong>of</strong><br />
exports to that group.<br />
(ii)<br />
Global exports <strong>of</strong> Handicrafts (HC)<br />
= Exports <strong>of</strong> Handicrafts was <strong>of</strong> the<br />
order <strong>of</strong> US$ 1.45 Billion in 2007-08<br />
and had drastically reduced to US$<br />
1.09 Billion in 2008-09 and further<br />
went down to US$ 961.67 Million<br />
in 2009-10. However, during the<br />
financial year 2010-11, the exports<br />
<strong>of</strong> handicrafts has appreciated to<br />
USD 1.19 billion, recording a surge<br />
<strong>of</strong> 24.46%.<br />
(iii) Global exports <strong>of</strong> Handlooms (HL)<br />
= Harmonized System <strong>of</strong> Classification<br />
for Handlooms products was<br />
introduced in 2009-10.<br />
= Exports <strong>of</strong> Handlooms during 2009-<br />
10 were <strong>of</strong> the order <strong>of</strong> US$ 260<br />
Million and increased to 365 million<br />
in 2010-11, recording a growth<br />
<strong>of</strong> 38%.<br />
= The biggest destination <strong>of</strong> India’s<br />
Handlooms products is the USA<br />
followed by the EU.<br />
Country-wise analysis<br />
= In the global market exports <strong>of</strong><br />
clothing, India ranked as the sixth<br />
largest exporter as per WTO data<br />
– 2010 (latest), trailing Turkey,<br />
Bangladesh, Hong Kong, EU-27<br />
and China. In the global exports <strong>of</strong><br />
<strong>Textiles</strong>, India ranked as the third<br />
largest exporter, trailing EU-27 and<br />
China, as per WTO data – 2010<br />
(latest).<br />
= Since August, 2008, the major<br />
markets for India’s exports <strong>of</strong> T&C<br />
products viz. USA, EU and Japan<br />
have witnessed recessionary<br />
conditions and financial crisis, and<br />
<strong>textiles</strong> sector was amongst the<br />
worst hit. However these adverse<br />
economic conditions appeared to<br />
have abated somewhat since 2010<br />
with the USA, the single largest<br />
importer <strong>of</strong> <strong>textiles</strong> and clothing<br />
items, observing a positive growth<br />
<strong>of</strong> 14.22% and 17.03% in its import<br />
<strong>of</strong> T&C from the world and India<br />
respectively during the calendar<br />
year 2010. This trend has continued<br />
during 2011 when USA observed<br />
a positive growth <strong>of</strong> 8.90% and<br />
10.32% in its imports <strong>of</strong> T&C from the<br />
world and India respectively. Almost<br />
all major T&C exporting countries<br />
showed positive trend in the US<br />
market during the first nine month <strong>of</strong><br />
calendar year 2011. (Source: GTIS)<br />
= The EU’s overall T&C import<br />
registered a growth <strong>of</strong> 7.30% in<br />
2008, decline <strong>of</strong> 11.87% in 2009 and<br />
growth <strong>of</strong> 7.67% in calendar year<br />
2010. In calendar year 2011, EU’s<br />
overall imports <strong>of</strong> T&C have grown<br />
by 15.38% while India recorded<br />
54