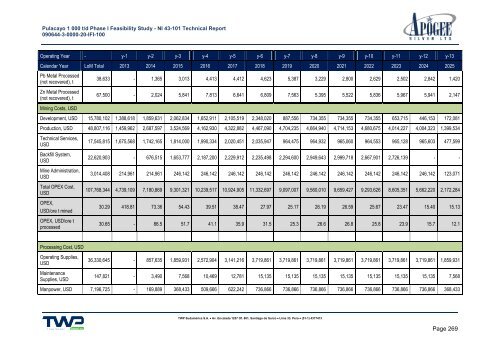
<strong>Pulacayo</strong> 1 000 t/d Phase I <strong>Feasibility</strong> <strong>Study</strong> - NI 43-101 Technical Report 090644-3-0000-20-IFI-100 Operating Year - y-1 y-2 y-3 y-4 y-5 y-6 y-7 y-8 y-9 y-10 y-11 y-12 y-13 Calendar Year LoM Total 2013 2014 2015 2016 2017 2018 2019 2020 2021 2022 2023 2024 2025 Pb Metal Processed (not recovered), t Zn Metal Processed (not recovered), t 38,633 - 1,365 3,013 4,413 4,412 4,623 5,387 3,229 2,800 2,629 2,502 2,842 1,420 67,500 - 2,024 5,841 7,813 6,641 6,809 7,563 5,395 5,522 5,836 5,967 5,941 2,147 Mining Costs, USD Development, USD 15,780,102 1,388,618 1,859,631 2,062,834 1,652,911 2,105,519 2,348,020 887,556 734,355 734,355 734,355 653,715 446,153 172,081 Production, USD 48,807,116 1,459,962 2,687,597 3,524,569 4,162,930 4,322,882 4,467,090 4,704,235 4,664,940 4,714,153 4,680,675 4,014,227 4,004,323 1,399,534 Technical Services, USD Backfill System, USD Mine Administration, USD Total OPEX Cost, USD OPEX, USD/ore t mined OPEX, USD/ore t processed 17,545,815 1,675,568 1,742,165 1,814,000 1,990,334 2,020,451 2,035,947 964,475 964,932 965,060 964,553 965,128 965,603 477,599 22,620,903 - 676,515 1,653,777 2,187,200 2,229,912 2,235,498 2,294,600 2,949,643 2,999,718 2,667,901 2,726,139 - - 3,014,408 214,961 214,961 246,142 246,142 246,142 246,142 246,142 246,142 246,142 246,142 246,142 246,142 123,071 107,768,344 4,739,109 7,180,869 9,301,321 10,239,517 10,924,905 11,332,697 9,097,007 9,560,010 9,659,427 9,293,626 8,605,351 5,662,220 2,172,284 30.29 418.81 73.36 54.43 39.51 38.47 27.97 25.17 26.19 26.59 25.67 23.47 15.40 15.13 30.65 - 86.5 51.7 41.1 35.9 31.5 25.3 26.6 26.8 25.8 23.9 15.7 12.1 Processing Cost, USD Operating Supplies, USD Maintenance Supplies, USD 36,330,645 - 857,635 1,859,931 2,572,904 3,141,216 3,719,861 3,719,861 3,719,861 3,719,861 3,719,861 3,719,861 3,719,861 1,859,931 147,821 - 3,490 7,568 10,469 12,781 15,135 15,135 15,135 15,135 15,135 15,135 15,135 7,568 Manpower, USD 7,196,725 - 169,889 368,433 509,666 622,242 736,866 736,866 736,866 736,866 736,866 736,866 736,866 368,433 TWP Sudamérica S.A. Av. Encalada 1257 Of. 801, Santiago de Surco Lima 33, Perú (51-1) 4377473 Page 269
<strong>Pulacayo</strong> 1 000 t/d Phase I <strong>Feasibility</strong> <strong>Study</strong> - NI 43-101 Technical Report 090644-3-0000-20-IFI-100 Operating Year - y-1 y-2 y-3 y-4 y-5 y-6 y-7 y-8 y-9 y-10 y-11 y-12 y-13 Calendar Year LoM Total 2013 2014 2015 2016 2017 2018 2019 2020 2021 2022 2023 2024 2025 General & Admin – Processing, USD Total OPEX Cost, USD OPEX, USD/ore t processed 9,789,228 - 231,088 501,155 693,264 846,395 1,002,310 1,002,310 1,002,310 1,002,310 1,002,310 1,002,310 1,002,310 501,155 53,464,419 - 1,262,101 2,737,086 3,786,303 4,622,635 5,474,173 5,474,173 5,474,173 5,474,173 5,474,173 5,474,173 5,474,173 2,737,086 15.2 - 15.2 15.2 15.2 15.2 15.2 15.2 15.2 15.2 15.2 15.2 15.2 15.2 General & Admin G&A Labour, USD 6,679,875 534,390 534,390 534,390 534,390 534,390 534,390 534,390 534,390 534,390 534,390 534,390 534,390 267,195 G&A Power, USD - - - - - - - - - - - - - - Third Party Services: Catering, Camp Cleaning, USD External Assays, USD External Consulting And Software, USD Equipment And Vehicle Rental (Heavy And Light), USD Safety/Protective Clothing (EPP), USD Postage, Courier And Light Freight, USD Office/Computer Supplies/Maintenan 2,828,750 226,300 226,300 226,300 226,300 226,300 226,300 226,300 226,300 226,300 226,300 226,300 226,300 113,150 - - - - - - - - - - - - - - 7,750 620 620 620 620 620 620 620 620 620 620 620 620 310 - - - - - - - - - - - - - - 187,500 15,000 15,000 15,000 15,000 15,000 15,000 15,000 15,000 15,000 15,000 15,000 15,000 7,500 250,000 20,000 20,000 20,000 20,000 20,000 20,000 20,000 20,000 20,000 20,000 20,000 20,000 10,000 125,000 10,000 10,000 10,000 10,000 10,000 10,000 10,000 10,000 10,000 10,000 10,000 10,000 5,000 TWP Sudamérica S.A. Av. Encalada 1257 Of. 801, Santiago de Surco Lima 33, Perú (51-1) 4377473 Page 270
- Page 1 and 2:
NI 43 — 101 TECHNICAL REPORT PULA
- Page 3 and 4:
Pulacayo 1 000 t/d Phase I Feasibil
- Page 5 and 6:
Pulacayo 1 000 t/d Phase I Feasibil
- Page 7 and 8:
Pulacayo 1 000 t/d Phase I Feasibil
- Page 9 and 10:
Pulacayo 1 000 t/d Phase I Feasibil
- Page 11 and 12:
Pulacayo 1 000 t/d Phase I Feasibil
- Page 13 and 14:
Pulacayo 1 000 t/d Phase I Feasibil
- Page 15 and 16:
Pulacayo 1 000 t/d Phase I Feasibil
- Page 17 and 18:
Pulacayo 1 000 t/d Phase I Feasibil
- Page 19 and 20:
Pulacayo 1 000 t/d Phase I Feasibil
- Page 21 and 22:
Pulacayo 1 000 t/d Phase I Feasibil
- Page 23 and 24:
Pulacayo 1 000 t/d Phase I Feasibil
- Page 25 and 26:
Pulacayo 1 000 t/d Phase I Feasibil
- Page 27 and 28:
Pulacayo 1 000 t/d Phase I Feasibil
- Page 29 and 30:
Pulacayo 1 000 t/d Phase I Feasibil
- Page 31 and 32:
Pulacayo 1 000 t/d Phase I Feasibil
- Page 33 and 34:
Pulacayo 1 000 t/d Phase I Feasibil
- Page 35 and 36:
Pulacayo 1 000 t/d Phase I Feasibil
- Page 37 and 38:
Pulacayo 1 000 t/d Phase I Feasibil
- Page 39 and 40:
Pulacayo 1 000 t/d Phase I Feasibil
- Page 41 and 42:
Pulacayo 1 000 t/d Phase I Feasibil
- Page 43 and 44:
Pulacayo 1 000 t/d Phase I Feasibil
- Page 45 and 46:
Pulacayo 1 000 t/d Phase I Feasibil
- Page 47 and 48:
Pulacayo 1 000 t/d Phase I Feasibil
- Page 49 and 50:
Pulacayo 1 000 t/d Phase I Feasibil
- Page 51 and 52:
Pulacayo 1 000 t/d Phase I Feasibil
- Page 53 and 54:
Pulacayo 1 000 t/d Phase I Feasibil
- Page 55 and 56:
Pulacayo 1 000 t/d Phase I Feasibil
- Page 57 and 58:
Pulacayo 1 000 t/d Phase I Feasibil
- Page 59 and 60:
Pulacayo 1 000 t/d Phase I Feasibil
- Page 61 and 62:
Pulacayo 1 000 t/d Phase I Feasibil
- Page 63 and 64:
Pulacayo 1 000 t/d Phase I Feasibil
- Page 65 and 66:
Pulacayo 1 000 t/d Phase I Feasibil
- Page 67 and 68:
Pulacayo 1 000 t/d Phase I Feasibil
- Page 69 and 70:
Pulacayo 1 000 t/d Phase I Feasibil
- Page 71 and 72:
Pulacayo 1 000 t/d Phase I Feasibil
- Page 73 and 74:
Pulacayo 1 000 t/d Phase I Feasibil
- Page 75 and 76:
Pulacayo 1 000 t/d Phase I Feasibil
- Page 77 and 78:
Pulacayo 1 000 t/d Phase I Feasibil
- Page 79 and 80:
Pulacayo 1 000 t/d Phase I Feasibil
- Page 81 and 82:
Pulacayo 1 000 t/d Phase I Feasibil
- Page 83 and 84:
Pulacayo 1 000 t/d Phase I Feasibil
- Page 85 and 86:
Pulacayo 1 000 t/d Phase I Feasibil
- Page 87 and 88:
Pulacayo 1 000 t/d Phase I Feasibil
- Page 89 and 90:
Pulacayo 1 000 t/d Phase I Feasibil
- Page 91 and 92:
Pulacayo 1 000 t/d Phase I Feasibil
- Page 93 and 94:
Pulacayo 1 000 t/d Phase I Feasibil
- Page 95 and 96:
Pulacayo 1 000 t/d Phase I Feasibil
- Page 97 and 98:
Pulacayo 1 000 t/d Phase I Feasibil
- Page 99 and 100:
Pulacayo 1 000 t/d Phase I Feasibil
- Page 101 and 102:
Pulacayo 1 000 t/d Phase I Feasibil
- Page 103 and 104:
Pulacayo 1 000 t/d Phase I Feasibil
- Page 105 and 106:
Pulacayo 1 000 t/d Phase I Feasibil
- Page 107 and 108:
Pulacayo 1 000 t/d Phase I Feasibil
- Page 109 and 110:
Pulacayo 1 000 t/d Phase I Feasibil
- Page 111 and 112:
Pulacayo 1 000 t/d Phase I Feasibil
- Page 113 and 114:
Pulacayo 1 000 t/d Phase I Feasibil
- Page 115 and 116:
Pulacayo 1 000 t/d Phase I Feasibil
- Page 117 and 118:
Pulacayo 1 000 t/d Phase I Feasibil
- Page 119 and 120:
Pulacayo 1 000 t/d Phase I Feasibil
- Page 121 and 122:
Pulacayo 1 000 t/d Phase I Feasibil
- Page 123 and 124:
Pulacayo 1 000 t/d Phase I Feasibil
- Page 125 and 126:
Pulacayo 1 000 t/d Phase I Feasibil
- Page 127 and 128:
Pulacayo 1 000 t/d Phase I Feasibil
- Page 129 and 130:
Pulacayo 1 000 t/d Phase I Feasibil
- Page 131 and 132:
Pulacayo 1 000 t/d Phase I Feasibil
- Page 133 and 134:
Pulacayo 1 000 t/d Phase I Feasibil
- Page 135 and 136:
Pulacayo 1 000 t/d Phase I Feasibil
- Page 137 and 138:
Pulacayo 1 000 t/d Phase I Feasibil
- Page 139 and 140:
Pulacayo 1 000 t/d Phase I Feasibil
- Page 141 and 142:
Pulacayo 1 000 t/d Phase I Feasibil
- Page 143 and 144:
Pulacayo 1 000 t/d Phase I Feasibil
- Page 145 and 146:
Pulacayo 1 000 t/d Phase I Feasibil
- Page 147 and 148:
Pulacayo 1 000 t/d Phase I Feasibil
- Page 149 and 150:
Pulacayo 1 000 t/d Phase I Feasibil
- Page 151 and 152:
Pulacayo 1 000 t/d Phase I Feasibil
- Page 153 and 154:
Pulacayo 1 000 t/d Phase I Feasibil
- Page 155 and 156:
Pulacayo 1 000 t/d Phase I Feasibil
- Page 157 and 158:
Pulacayo 1 000 t/d Phase I Feasibil
- Page 159 and 160:
Pulacayo 1 000 t/d Phase I Feasibil
- Page 161 and 162:
Pulacayo 1 000 t/d Phase I Feasibil
- Page 163 and 164:
Pulacayo 1 000 t/d Phase I Feasibil
- Page 165 and 166:
Pulacayo 1 000 t/d Phase I Feasibil
- Page 167 and 168:
Pulacayo 1 000 t/d Phase I Feasibil
- Page 169 and 170:
Pulacayo 1 000 t/d Phase I Feasibil
- Page 171 and 172:
Pulacayo 1 000 t/d Phase I Feasibil
- Page 173 and 174:
Pulacayo 1 000 t/d Phase I Feasibil
- Page 175 and 176:
Pulacayo 1 000 t/d Phase I Feasibil
- Page 177 and 178:
Pulacayo 1 000 t/d Phase I Feasibil
- Page 179 and 180:
Pulacayo 1 000 t/d Phase I Feasibil
- Page 181 and 182:
Pulacayo 1 000 t/d Phase I Feasibil
- Page 183 and 184:
Pulacayo 1 000 t/d Phase I Feasibil
- Page 185 and 186:
Pulacayo 1 000 t/d Phase I Feasibil
- Page 187 and 188:
Pulacayo 1 000 t/d Phase I Feasibil
- Page 189 and 190:
Pulacayo 1 000 t/d Phase I Feasibil
- Page 191 and 192:
Pulacayo 1 000 t/d Phase I Feasibil
- Page 193 and 194:
Pulacayo 1 000 t/d Phase I Feasibil
- Page 195 and 196:
Pulacayo 1 000 t/d Phase I Feasibil
- Page 197 and 198:
Pulacayo 1 000 t/d Phase I Feasibil
- Page 199 and 200:
Pulacayo 1 000 t/d Phase I Feasibil
- Page 201 and 202:
Pulacayo 1 000 t/d Phase I Feasibil
- Page 203 and 204:
Pulacayo 1 000 t/d Phase I Feasibil
- Page 205 and 206:
Pulacayo 1 000 t/d Phase I Feasibil
- Page 207 and 208:
Pulacayo 1 000 t/d Phase I Feasibil
- Page 209 and 210:
Pulacayo 1 000 t/d Phase I Feasibil
- Page 211 and 212:
Pulacayo 1 000 t/d Phase I Feasibil
- Page 213 and 214:
Pulacayo 1 000 t/d Phase I Feasibil
- Page 215 and 216:
Pulacayo 1 000 t/d Phase I Feasibil
- Page 217 and 218:
Pulacayo 1 000 t/d Phase I Feasibil
- Page 219 and 220:
Pulacayo 1 000 t/d Phase I Feasibil
- Page 221 and 222:
Pulacayo 1 000 t/d Phase I Feasibil
- Page 223 and 224:
Pulacayo 1 000 t/d Phase I Feasibil
- Page 225 and 226:
Pulacayo 1 000 t/d Phase I Feasibil
- Page 227 and 228:
Pulacayo 1 000 t/d Phase I Feasibil
- Page 229 and 230:
Pulacayo 1 000 t/d Phase I Feasibil
- Page 231 and 232: Pulacayo 1 000 t/d Phase I Feasibil
- Page 233 and 234: Pulacayo 1 000 t/d Phase I Feasibil
- Page 235 and 236: Pulacayo 1 000 t/d Phase I Feasibil
- Page 237 and 238: Pulacayo 1 000 t/d Phase I Feasibil
- Page 239 and 240: Pulacayo 1 000 t/d Phase I Feasibil
- Page 241 and 242: Pulacayo 1 000 t/d Phase I Feasibil
- Page 243 and 244: Pulacayo 1 000 t/d Phase I Feasibil
- Page 245 and 246: Pulacayo 1 000 t/d Phase I Feasibil
- Page 247 and 248: Pulacayo 1 000 t/d Phase I Feasibil
- Page 249 and 250: Pulacayo 1 000 t/d Phase I Feasibil
- Page 251 and 252: Pulacayo 1 000 t/d Phase I Feasibil
- Page 253 and 254: Pulacayo 1 000 t/d Phase I Feasibil
- Page 255 and 256: Pulacayo 1 000 t/d Phase I Feasibil
- Page 257 and 258: Pulacayo 1 000 t/d Phase I Feasibil
- Page 259 and 260: Pulacayo 1 000 t/d Phase I Feasibil
- Page 261 and 262: Pulacayo 1 000 t/d Phase I Feasibil
- Page 263 and 264: Pulacayo 1 000 t/d Phase I Feasibil
- Page 265 and 266: Pulacayo 1 000 t/d Phase I Feasibil
- Page 267 and 268: Pulacayo 1 000 t/d Phase I Feasibil
- Page 269 and 270: Pulacayo 1 000 t/d Phase I Feasibil
- Page 271 and 272: Pulacayo 1 000 t/d Phase I Feasibil
- Page 273 and 274: Pulacayo 1 000 t/d Phase I Feasibil
- Page 275 and 276: Pulacayo 1 000 t/d Phase I Feasibil
- Page 277 and 278: Pulacayo 1 000 t/d Phase I Feasibil
- Page 279 and 280: Pulacayo 1 000 t/d Phase I Feasibil
- Page 281: Pulacayo 1 000 t/d Phase I Feasibil
- Page 285 and 286: Pulacayo 1 000 t/d Phase I Feasibil
- Page 287 and 288: Pulacayo 1 000 t/d Phase I Feasibil
- Page 289 and 290: Pulacayo 1 000 t/d Phase I Feasibil
- Page 291 and 292: Pulacayo 1 000 t/d Phase I Feasibil
- Page 293 and 294: Pulacayo 1 000 t/d Phase I Feasibil
- Page 295 and 296: Pulacayo 1 000 t/d Phase I Feasibil
- Page 297 and 298: Pulacayo 1 000 t/d Phase I Feasibil
- Page 299 and 300: Pulacayo 1 000 t/d Phase I Feasibil
- Page 301 and 302: Pulacayo 1 000 t/d Phase I Feasibil
- Page 303 and 304: Pulacayo 1 000 t/d Phase I Feasibil
- Page 305 and 306: Pulacayo 1 000 t/d Phase I Feasibil
- Page 307 and 308: Pulacayo 1 000 t/d Phase I Feasibil
- Page 309 and 310: Pulacayo 1 000 t/d Phase I Feasibil