EL Sistema de Salud del Perú
EL Sistema de Salud del Perú
EL Sistema de Salud del Perú

You also want an ePaper? Increase the reach of your titles
YUMPU automatically turns print PDFs into web optimized ePapers that Google loves.
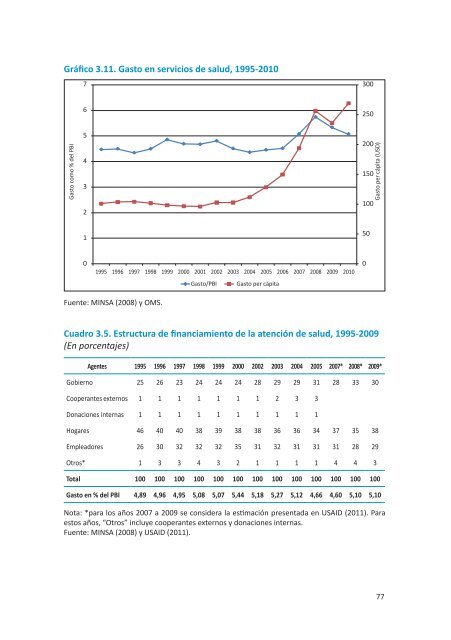
Gráfico 3.11. Gasto en servicios <strong>de</strong> salud, 1995-2010<br />
7<br />
300<br />
6<br />
250<br />
Gasto como % <strong>de</strong>l PBI<br />
5<br />
4<br />
3<br />
2<br />
200<br />
150<br />
100<br />
Gasto per cápita (USD)<br />
1<br />
50<br />
0<br />
1995 1996 1997 1998 1999 2000 2001 2002 2003 2004 2005 2006 2007 2008 2009 2010<br />
Gasto/PBI<br />
Gasto per cápita<br />
0<br />
Fuente: MINSA (2008) y OMS.<br />
Cuadro 3.5. Estructura <strong>de</strong> financiamiento <strong>de</strong> la atención <strong>de</strong> salud, 1995-2009<br />
(En porcentajes)<br />
Agentes 1995 1996 1997 1998 1999 2000 2002 2003 2004 2005 2007* 2008* 2009*<br />
Gobierno 25 26 23 24 24 24 28 29 29 31 28 33 30<br />
Cooperantes externos 1 1 1 1 1 1 1 2 3 3<br />
Donaciones internas 1 1 1 1 1 1 1 1 1 1<br />
Hogares 46 40 40 38 39 38 38 36 36 34 37 35 38<br />
Empleadores 26 30 32 32 32 35 31 32 31 31 31 28 29<br />
Otros* 1 3 3 4 3 2 1 1 1 1 4 4 3<br />
Total 100 100 100 100 100 100 100 100 100 100 100 100 100<br />
Gasto en % <strong>de</strong>l PBI 4,89 4,96 4,95 5,08 5,07 5,44 5,18 5,27 5,12 4,66 4,60 5,10 5,10<br />
Nota: *para los años 2007 a 2009 se consi<strong>de</strong>ra la estimación presentada en USAID (2011). Para<br />
estos años, “Otros” incluye cooperantes externos y donaciones internas.<br />
Fuente: MINSA (2008) y USAID (2011).<br />
77