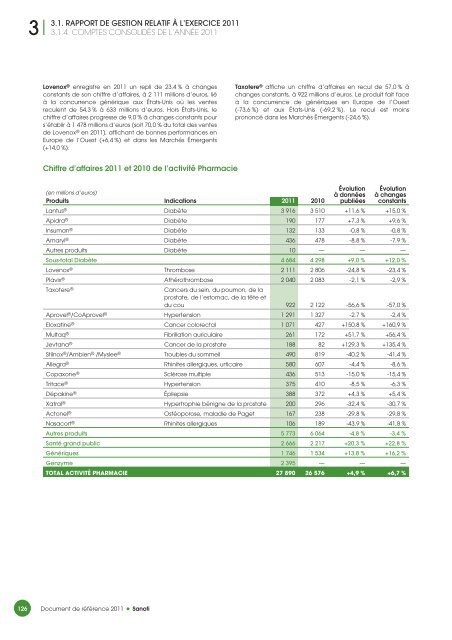
33.1.RAPPORT DE GESTION RELATIF À L’EXERCICE <strong>2011</strong>3.1.4. COMPTES CONSOLIDÉS DE L’ANNÉE <strong>2011</strong>Lovenox ® enregistre en <strong>2011</strong> un repli de 23,4 % à changesconstants de son chiffre d’affaires, à 2 111 millions d’euros, liéà la concurrence générique aux États-Unis où les ventesreculent de 54,3 % à 633 millions d’euros. Hors États-Unis, lechiffre d’affaires progresse de 9,0 % à changes constants pours’établir à 1 478 millions d’euros (soit 70,0 % du total des ventesde Lovenox ® en <strong>2011</strong>), affichant de bonnes performances enEurope de l’Ouest (+6,4 %) et dans les Marchés Émergents(+14,0 %).Taxotere ® affiche un chiffre d’affaires en recul de 57,0 % àchanges constants, à 922 millions d’euros. Le produit fait faceà la concurrence de génériques en Europe de l’Ouest(-73,6 %) et aux États-Unis (-69,2 %). Le recul est moinsprononcé dans les Marchés Émergents (-24,6 %).Chiffre d’affaires <strong>2011</strong> et 2010 de l’activité Pharmacie(en millions d’euros)Produits Indications <strong>2011</strong> 2010Évolutionà donnéespubliéesÉvolutionà changesconstantsLantus ® Diabète 3 916 3 510 +11,6 % +15,0 %Apidra ® Diabète 190 177 +7,3 % +9,6 %Insuman ® Diabète 132 133 -0,8 % -0,8 %Amaryl ® Diabète 436 478 -8,8 % -7,9 %Autres produits Diabète 10 — — —Sous-total Diabète 4 684 4 298 +9,0 % +12,0 %Lovenox ® Thrombose 2 111 2 806 -24,8 % -23,4 %Plavix ® Athérothrombose 2 040 2 083 -2,1 % -2,9 %Taxotere ®Cancers du sein, du poumon, de laprostate, de l’estomac, de la tête etdu cou 922 2 122 -56,6 % -57,0 %Aprovel ® /CoAprovel ® Hypertension 1 291 1 327 -2,7 % -2,4 %Eloxatine ® Cancer colorectal 1 071 427 +150,8 % +160,9 %Multaq ® Fibrillation auriculaire 261 172 +51,7 % +56,4 %Jevtana ® Cancer de la prostate 188 82 +129,3 % +135,4 %Stilnox ® /Ambien ® /Myslee ® Troubles du sommeil 490 819 -40,2 % -41,4 %Allegra ® Rhinites allergiques, urticaire 580 607 -4,4 % -8,6 %Copaxone ® Sclérose multiple 436 513 -15,0 % -15,4 %Tritace ® Hypertension 375 410 -8,5 % -6,3 %Dépakine ® Épilepsie 388 372 +4,3 % +5,4 %Xatral ® Hypertrophie bénigne de la prostate 200 296 -32,4 % -30,7 %Actonel ® Ostéoporose, maladie de Paget 167 238 -29,8 % -29,8 %Nasacort ® Rhinites allergiques 106 189 -43,9 % -41,8 %Autres produits 5 773 6 064 -4,8 % -3,4 %Santé grand public 2 666 2 217 +20,3 % +22,8 %Génériques 1 746 1 534 +13,8 % +16,2 %Genzyme 2 395 — — —TOTAL ACTIVITÉ PHARMACIE 27 890 26 576 +4,9 % +6,7 %126 Document de référence <strong>2011</strong> Š Sanofi
Chiffre d’affaires <strong>2011</strong> de l’activité Pharmacie par zone géographique(en millions d’euros)Évolutionà changesconstants3.1. RAPPORT DE GESTION RELATIF À L’EXERCICE <strong>2011</strong>3.1.4. COMPTES CONSOLIDÉS DE L’ANNÉE <strong>2011</strong> 3Évolutionà changesconstantsÉvolutionà changesconstantsÉvolutionà changesconstantsProduitsEurope del’Ouest (1)États-UnisMarchésÉmergents (2)Autrespays (3)Lantus ® 730 +6,4 % 2 336 +14,6 % 617 +26,0 % 233 +22,3 %Apidra ® 68 0,0 % 65 +11,3 % 37 +8,6 % 20 +58,3 %Insuman ® 103 -4,6 % — — 29 +20,0 % — —Amaryl ® 32 -23,8 % 4 -33,3 % 228 +8,6 % 172 -21,6 %Autres produits 10 — — — — — — —Sous-total Diabète 943 +4,3 % 2 405 +14,4 % 911 +20,1 % 425 +0,5 %Lovenox ® 833 +6,4 % 633 -54,3 % 551 +14,0 % 94 +3,5 %Plavix ® 414 -35,6 % 196* -8,0 % 706 +11,9 % 724 +18,6 %Taxotere ® 189 -73,6 % 243 -69,2 % 294 -24,6 % 196 -20,2 %Aprovel ® /CoAprovel ® 753 -9,1 % 49* +25,6 % 363 +6,7 % 126 +8,6 %Eloxatine ® 38 -19,6 % 806 +393,0 % 162 +9,3 % 65 +10,2 %Multaq ® 66 +66,7 % 184 +50,8 % 7 +250,0 % 4 +33,3 %Jevtana ® 44 — 131 +65,9 % 13 — — —Stilnox ® /Ambien ® /Myslee ® 53 -3,6 % 82 -80,6 % 65 -1,5 % 290 +8,3 %Allegra ® 13 -18,8 % 3 -98,6 % 99 +19,3 % 465 +22,2 %Copaxone ® 415 -14,1 % — — — -100,0 % 21 +11,1 %Tritace ® 170 -10,1 % — — 181 0,0 % 24 -23,3 %Dépakine ® 145 -2,0 % — — 227 +11,5 % 16 -6,7 %Xatral ® 58 -12,1 % 75 -49,7 % 63 -7,1 % 4 -20,0 %Actonel ® 54 -48,1 % — — 78 -12,9 % 35 -22,0 %Nasacort ® 25 -10,7 % 54 -57,7 % 23 0,0 % 4 -20,0 %Autres produits 2 417 -8,9 % 497 -19,9 % 2 106 +7,4 % 753 +1,4 %Santé grand public 651 +3,2 % 549 +80,0 % 1 225 +20,8 % 241 +5,1 %Génériques 443 +9,4 % 177 +79,4 % 1 092 +14,0 % 34 -20,0 %Genzyme 621 — 1 180 — 347 — 247 —TOTAL ACTIVITÉ PHARMACIE 8 345 -3,9 % 7 264 +8,5 % 8 513 +15,0 % 3 768 +14,0 %3 /// RAPPORT DE GESTION, ÉTATS FINANCIERS ET INFORMATIONS FINANCIÈRES COMPLÉMENTAIRES(1) France, Allemagne, Royaume-Uni, Italie, Espagne, Grèce, Chypre, Malte, Belgique, Luxembourg, Portugal, Pays-Bas, Autriche, Suisse,Suède, Irlande, Finlande, Norvège, Islande, Danemark.(2) Monde hors États-Unis, Canada, Europe de l’Ouest, Japon, Australie et Nouvelle-Zélande.(3) Japon, Canada, Australie et Nouvelle-Zélande.* Ventes de principe actif à l’entité majoritairement détenue par BMS aux États-Unis.Eloxatine ® enregistre en <strong>2011</strong> un fort rebond de son chiffred’affaires de 160,9 % à changes constants à 1 071 millionsd’euros, reflétant la reprise des ventes aux États-Unis(806 millions d’euros, contre 172 millions d’euros en 2010), liéeà une décision de justice qui interdit aux fabricants degénériques dans ce pays de commercialiser leurs génériquesnon autorisés d’oxaliplatine depuis le 30 juin 2010.Multaq ® affiche une croissance à changes constants de56,4 % à 261 millions d’euros, réalisée principalement auxÉtats-Unis (184 millions d’euros) et en Europe de l’Ouest(66 millions d’euros).Jevtana ® , qui est disponible sur le marché américain depuisjuillet 2010 et progressivement disponible dans la plupart despays de l’Europe de l’Ouest depuis avril <strong>2011</strong>, enregistre unchiffre d’affaires de 188 millions d’euros en <strong>2011</strong>, dont131 millions d’euros aux États-Unis.Le chiffre d’affaires de l’hypnotique Stilnox ® /Ambien ® /Myslee ®est en recul de 41,4 % à changes constants, à 490 millionsd’euros, reflétant la concurrence des génériques d’Ambien ®CR aux États-Unis. Au Japon, Myslee ® continue d’afficher unesolide performance avec un chiffre d’affaires de 284 millionsd’eurosencroissancede9,2%àchangesconstants.Allegra ® enregistre un chiffre d’affaires sous ordonnance enrecul de 8,6 % (à changes constants) à 580 millions d’euros.Au Japon, qui représente 80,2 % des ventes mondialesd’Allegra ® , le chiffre d’affaires atteint 465 millions d’euros(+22,1 % à changes constants) avec la forte augmentationdes allergies saisonnières. La chute des ventes sousordonnance aux États-Unis (-98,6 % à changes constants)reflète principalement la conversion d’Allegra ® en produit envente libre à partir de mars <strong>2011</strong> sur le marché américain.Depuis cette conversion, les ventes d’Allegra ® aux États-Unissont incluses dans l’activité Santé Grand Public.Les autres produits importants du Groupe sont présentésci-dessous.Document de référence <strong>2011</strong> Š Sanofi 127
- Page 1:
DOCUMENT2011DE RÉFÉRENCESANOFI
- Page 5 and 6:
Déclarations prospectivesLe prése
- Page 7 and 8:
Les données fournies par IMS et pr
- Page 9 and 10:
1 PRÉSENTATIONDU GROUPE1.1PRINCIPA
- Page 11:
1.1. PRINCIPALES INFORMATIONS RELAT
- Page 14 and 15:
11.1.PRINCIPALES INFORMATIONS RELAT
- Page 16 and 17:
11.1.PRINCIPALES INFORMATIONS RELAT
- Page 18 and 19:
11.2.GOUVERNEMENT D’ENTREPRISE1.2
- Page 20 and 21:
11.2.GOUVERNEMENT D’ENTREPRISE1.2
- Page 22 and 23:
11.2.GOUVERNEMENT D’ENTREPRISE1.2
- Page 24 and 25:
11.2.GOUVERNEMENT D’ENTREPRISE1.2
- Page 26 and 27:
11.2.GOUVERNEMENT D’ENTREPRISE1.2
- Page 28 and 29:
11.2.GOUVERNEMENT D’ENTREPRISE1.2
- Page 30 and 31:
11.2.GOUVERNEMENT D’ENTREPRISE1.2
- Page 32 and 33:
11.2.GOUVERNEMENT D’ENTREPRISE1.2
- Page 34 and 35:
11.2.GOUVERNEMENT D’ENTREPRISE1.2
- Page 36 and 37:
11.2.GOUVERNEMENT D’ENTREPRISE1.2
- Page 38 and 39:
11.2.GOUVERNEMENT D’ENTREPRISE1.2
- Page 40 and 41:
11.2.GOUVERNEMENT D’ENTREPRISE1.2
- Page 42 and 43:
11.2.GOUVERNEMENT D’ENTREPRISE1.2
- Page 44 and 45:
11.2.GOUVERNEMENT D’ENTREPRISE1.2
- Page 46 and 47:
11.2.GOUVERNEMENT D’ENTREPRISE1.2
- Page 48 and 49:
11.2.GOUVERNEMENT D’ENTREPRISE1.2
- Page 50 and 51:
11.2.GOUVERNEMENT D’ENTREPRISE1.2
- Page 52 and 53:
11.2.GOUVERNEMENT D’ENTREPRISE1.2
- Page 54 and 55:
11.2.GOUVERNEMENT D’ENTREPRISE1.2
- Page 56 and 57:
11.2.GOUVERNEMENT D’ENTREPRISE1.2
- Page 58 and 59:
11.2.GOUVERNEMENT D’ENTREPRISE1.2
- Page 60 and 61:
11.2.GOUVERNEMENT D’ENTREPRISE1.2
- Page 62 and 63:
2 INTRODUCTIONDans la suite de ce c
- Page 64 and 65:
22.2.PRÉSENTATION DE L’ACTIVITÉ
- Page 66 and 67:
22.2.PRÉSENTATION DE L’ACTIVITÉ
- Page 68 and 69:
22.2.PRÉSENTATION DE L’ACTIVITÉ
- Page 70 and 71:
22.2.PRÉSENTATION DE L’ACTIVITÉ
- Page 72 and 73:
22.2.PRÉSENTATION DE L’ACTIVITÉ
- Page 74 and 75:
22.2.PRÉSENTATION DE L’ACTIVITÉ
- Page 76 and 77:
22.2.PRÉSENTATION DE L’ACTIVITÉ
- Page 78 and 79:
22.2.PRÉSENTATION DE L’ACTIVITÉ
- Page 80 and 81:
22.2.PRÉSENTATION DE L’ACTIVITÉ
- Page 82 and 83:
22.2.PRÉSENTATION DE L’ACTIVITÉ
- Page 84 and 85: 22.2.PRÉSENTATION DE L’ACTIVITÉ
- Page 86 and 87: 22.2.PRÉSENTATION DE L’ACTIVITÉ
- Page 88 and 89: 22.2.PRÉSENTATION DE L’ACTIVITÉ
- Page 90 and 91: 22.2.PRÉSENTATION DE L’ACTIVITÉ
- Page 92 and 93: 22.2.PRÉSENTATION DE L’ACTIVITÉ
- Page 94 and 95: 22.2.PRÉSENTATION DE L’ACTIVITÉ
- Page 96 and 97: 22.2.PRÉSENTATION DE L’ACTIVITÉ
- Page 98 and 99: 22.2.PRÉSENTATION DE L’ACTIVITÉ
- Page 100 and 101: 22.2.PRÉSENTATION DE L’ACTIVITÉ
- Page 102 and 103: 22.2.PRÉSENTATION DE L’ACTIVITÉ
- Page 104 and 105: 22.2.PRÉSENTATION DE L’ACTIVITÉ
- Page 106 and 107: 22.2.PRÉSENTATION DE L’ACTIVITÉ
- Page 108 and 109: 22.2.PRÉSENTATION DE L’ACTIVITÉ
- Page 110 and 111: 22.2.PRÉSENTATION DE L’ACTIVITÉ
- Page 112 and 113: 22.3.ORGANISATION DU GROUPE2.3. ORG
- Page 114 and 115: 22.4.INVESTISSEMENTS - PRINCIPAUX
- Page 116 and 117: 22.4.INVESTISSEMENTS - PRINCIPAUX
- Page 118 and 119: 22.5.LITIGES2.5.1. BREVETSPlavix ®
- Page 120 and 121: 22.6.ÉVÉNEMENTS RÉCENTS2.6.1. LI
- Page 122 and 123: 33.1.RAPPORT DE GESTION RELATIF À
- Page 124 and 125: 33.1.RAPPORT DE GESTION RELATIF À
- Page 126 and 127: 33.1.RAPPORT DE GESTION RELATIF À
- Page 128 and 129: 33.1.RAPPORT DE GESTION RELATIF À
- Page 130 and 131: 33.1.RAPPORT DE GESTION RELATIF À
- Page 132 and 133: 33.1.RAPPORT DE GESTION RELATIF À
- Page 136 and 137: 33.1.RAPPORT DE GESTION RELATIF À
- Page 138 and 139: 33.1.RAPPORT DE GESTION RELATIF À
- Page 140 and 141: 33.1.RAPPORT DE GESTION RELATIF À
- Page 142 and 143: 33.1.RAPPORT DE GESTION RELATIF À
- Page 144 and 145: 33.1.RAPPORT DE GESTION RELATIF À
- Page 146 and 147: 33.1.RAPPORT DE GESTION RELATIF À
- Page 148 and 149: 33.1.RAPPORT DE GESTION RELATIF À
- Page 150 and 151: 33.1.RAPPORT DE GESTION RELATIF À
- Page 152 and 153: 33.1.RAPPORT DE GESTION RELATIF À
- Page 154 and 155: 33.1.RAPPORT DE GESTION RELATIF À
- Page 156 and 157: 33.1.RAPPORT DE GESTION RELATIF À
- Page 158 and 159: 33.1.RAPPORT DE GESTION RELATIF À
- Page 160 and 161: 33.1.RAPPORT DE GESTION RELATIF À
- Page 162 and 163: 33.1.RAPPORT DE GESTION RELATIF À
- Page 164 and 165: 33.1.RAPPORT DE GESTION RELATIF À
- Page 166 and 167: 33.1.RAPPORT DE GESTION RELATIF À
- Page 168 and 169: 33.1.RAPPORT DE GESTION RELATIF À
- Page 170 and 171: 33.1.RAPPORT DE GESTION RELATIF À
- Page 172 and 173: 33.1.RAPPORT DE GESTION RELATIF À
- Page 174 and 175: 33.1.RAPPORT DE GESTION RELATIF À
- Page 176 and 177: 33.1.RAPPORT DE GESTION RELATIF À
- Page 178 and 179: 33.1.RAPPORT DE GESTION RELATIF À
- Page 180 and 181: 33.2.RAPPORT DU PRÉSIDENT DU CONSE
- Page 182 and 183: 33.2.RAPPORT DU PRÉSIDENT DU CONSE
- Page 184 and 185:
33.2.RAPPORT DU PRÉSIDENT DU CONSE
- Page 186 and 187:
33.2.RAPPORT DU PRÉSIDENT DU CONSE
- Page 188 and 189:
33.3.ÉTATS FINANCIERS CONSOLIDÉS
- Page 190 and 191:
33.3.ÉTATS FINANCIERS CONSOLIDÉS
- Page 192 and 193:
33.3.ÉTATS FINANCIERS CONSOLIDÉS
- Page 194 and 195:
33.3.ÉTATS FINANCIERS CONSOLIDÉS
- Page 196 and 197:
33.3.ÉTATS FINANCIERS CONSOLIDÉS
- Page 198 and 199:
33.3.ÉTATS FINANCIERS CONSOLIDÉS
- Page 200 and 201:
33.3.ÉTATS FINANCIERS CONSOLIDÉS
- Page 202 and 203:
33.3.ÉTATS FINANCIERS CONSOLIDÉS
- Page 204 and 205:
33.3.ÉTATS FINANCIERS CONSOLIDÉS
- Page 206 and 207:
33.3.ÉTATS FINANCIERS CONSOLIDÉS
- Page 208 and 209:
33.3.ÉTATS FINANCIERS CONSOLIDÉS
- Page 210 and 211:
33.3.ÉTATS FINANCIERS CONSOLIDÉS
- Page 212 and 213:
33.3.ÉTATS FINANCIERS CONSOLIDÉS
- Page 214 and 215:
33.3.ÉTATS FINANCIERS CONSOLIDÉS
- Page 216 and 217:
33.3.ÉTATS FINANCIERS CONSOLIDÉS
- Page 218 and 219:
33.3.ÉTATS FINANCIERS CONSOLIDÉS
- Page 220 and 221:
33.3.ÉTATS FINANCIERS CONSOLIDÉS
- Page 222 and 223:
33.3.ÉTATS FINANCIERS CONSOLIDÉS
- Page 224 and 225:
33.3.ÉTATS FINANCIERS CONSOLIDÉS
- Page 226 and 227:
33.3.ÉTATS FINANCIERS CONSOLIDÉS
- Page 228 and 229:
33.3.ÉTATS FINANCIERS CONSOLIDÉS
- Page 230 and 231:
33.3.ÉTATS FINANCIERS CONSOLIDÉS
- Page 232 and 233:
33.3.ÉTATS FINANCIERS CONSOLIDÉS
- Page 234 and 235:
33.3.ÉTATS FINANCIERS CONSOLIDÉS
- Page 236 and 237:
33.3.ÉTATS FINANCIERS CONSOLIDÉS
- Page 238 and 239:
33.3.ÉTATS FINANCIERS CONSOLIDÉS
- Page 240 and 241:
33.3.ÉTATS FINANCIERS CONSOLIDÉS
- Page 242 and 243:
33.3.ÉTATS FINANCIERS CONSOLIDÉS
- Page 244 and 245:
33.3.ÉTATS FINANCIERS CONSOLIDÉS
- Page 246 and 247:
33.3.ÉTATS FINANCIERS CONSOLIDÉS
- Page 248 and 249:
33.3.ÉTATS FINANCIERS CONSOLIDÉS
- Page 250 and 251:
33.3.ÉTATS FINANCIERS CONSOLIDÉS
- Page 252 and 253:
33.3.ÉTATS FINANCIERS CONSOLIDÉS
- Page 254 and 255:
33.3.ÉTATS FINANCIERS CONSOLIDÉS
- Page 256 and 257:
33.3.ÉTATS FINANCIERS CONSOLIDÉS
- Page 258 and 259:
33.3.ÉTATS FINANCIERS CONSOLIDÉS
- Page 260 and 261:
33.3.ÉTATS FINANCIERS CONSOLIDÉS
- Page 262 and 263:
33.3.ÉTATS FINANCIERS CONSOLIDÉS
- Page 264 and 265:
33.3.ÉTATS FINANCIERS CONSOLIDÉS
- Page 266 and 267:
33.3.ÉTATS FINANCIERS CONSOLIDÉS
- Page 268 and 269:
33.3.ÉTATS FINANCIERS CONSOLIDÉS
- Page 270 and 271:
33.3.ÉTATS FINANCIERS CONSOLIDÉS
- Page 272 and 273:
33.3.ÉTATS FINANCIERS CONSOLIDÉS
- Page 274 and 275:
33.3.ÉTATS FINANCIERS CONSOLIDÉS
- Page 276 and 277:
33.3.ÉTATS FINANCIERS CONSOLIDÉS
- Page 278 and 279:
33.3.ÉTATS FINANCIERS CONSOLIDÉS
- Page 280 and 281:
33.3.ÉTATS FINANCIERS CONSOLIDÉS
- Page 282 and 283:
33.3.ÉTATS FINANCIERS CONSOLIDÉS
- Page 284 and 285:
33.3.ÉTATS FINANCIERS CONSOLIDÉS
- Page 286 and 287:
33.3.ÉTATS FINANCIERS CONSOLIDÉS
- Page 288 and 289:
33.3.ÉTATS FINANCIERS CONSOLIDÉS
- Page 290 and 291:
33.3.ÉTATS FINANCIERS CONSOLIDÉS
- Page 292 and 293:
33.4.COMPTES ANNUELS DE LA SOCIÉT
- Page 294 and 295:
33.4.COMPTES ANNUELS DE LA SOCIÉT
- Page 296 and 297:
33.4.COMPTES ANNUELS DE LA SOCIÉT
- Page 298 and 299:
33.4.COMPTES ANNUELS DE LA SOCIÉT
- Page 300 and 301:
33.4.COMPTES ANNUELS DE LA SOCIÉT
- Page 302 and 303:
33.4.COMPTES ANNUELS DE LA SOCIÉT
- Page 304 and 305:
33.4.COMPTES ANNUELS DE LA SOCIÉT
- Page 306 and 307:
33.4.COMPTES ANNUELS DE LA SOCIÉT
- Page 308 and 309:
33.4.COMPTES ANNUELS DE LA SOCIÉT
- Page 310 and 311:
33.4.COMPTES ANNUELS DE LA SOCIÉT
- Page 312 and 313:
33.4.COMPTES ANNUELS DE LA SOCIÉT
- Page 314 and 315:
33.4.COMPTES ANNUELS DE LA SOCIÉT
- Page 316 and 317:
33.4.COMPTES ANNUELS DE LA SOCIÉT
- Page 318 and 319:
33.4.COMPTES ANNUELS DE LA SOCIÉT
- Page 320 and 321:
33.4.COMPTES ANNUELS DE LA SOCIÉT
- Page 322 and 323:
33.4.COMPTES ANNUELS DE LA SOCIÉT
- Page 324 and 325:
33.4.COMPTES ANNUELS DE LA SOCIÉT
- Page 326 and 327:
33.4.COMPTES ANNUELS DE LA SOCIÉT
- Page 328 and 329:
44.1.SANOFI EN BOURSE4.1.2. DONNÉE
- Page 330 and 331:
44.2.L’INFORMATION AUX ACTIONNAIR
- Page 332 and 333:
44.2.L’INFORMATION AUX ACTIONNAIR
- Page 334 and 335:
55.3.PERSONNES RESPONSABLES DU CONT
- Page 336 and 337:
TABLE DE CONCORDANCE DU DOCUMENT DE
- Page 338 and 339:
TABLE DE CONCORDANCE DU DOCUMENT DE
- Page 340:
TABLE DE CONCORDANCE DU RAPPORT FIN
- Page 344:
SANOFI54, rue La Boétie 75008 Pari