- Page 1 and 2: DOCUMENT DE RÉFÉRENCE 2010ETRAPPO
- Page 3 and 4: DOCUMENTDE RÉFÉRENCE 2010ET RAPPO
- Page 5 and 6: MESSAGE DU PRÉSIDENT DIRECTEUR GÉ
- Page 7 and 8: 1PRÉSENTATIONDU GROUPE TF11.1 L’
- Page 9 and 10: PRÉSENTATION DU GROUPE TF11Organig
- Page 11 and 12: 1PRÉSENTATION DU GROUPE TF1Activit
- Page 13 and 14: 1PRÉSENTATION DU GROUPE TF1Activit
- Page 15 and 16: 1PRÉSENTATION DU GROUPE TF1Faits m
- Page 17 and 18: 1PRÉSENTATION DU GROUPE TF1Faits m
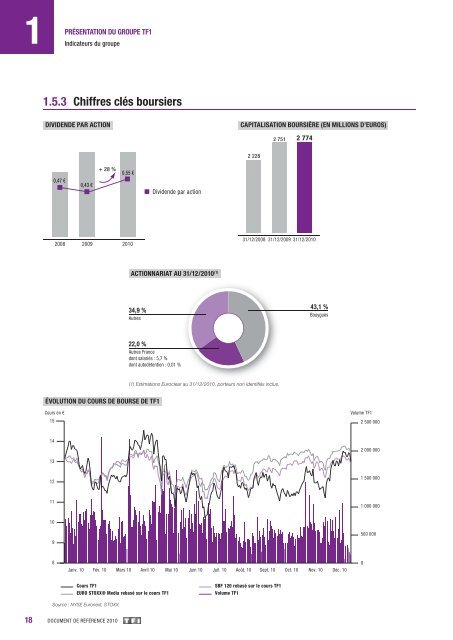
- Page 19: 1PRÉSENTATION DU GROUPE TF1Indicat
- Page 23 and 24: 1PRÉSENTATION DU GROUPE TF1Point s
- Page 25 and 26: 1PRÉSENTATION DU GROUPE TF1Point s
- Page 27 and 28: 1PRÉSENTATION DU GROUPE TF1Point s
- Page 29 and 30: 1PRÉSENTATION DU GROUPE TF1Point s
- Page 31 and 32: 1PRÉSENTATION DU GROUPE TF1Point s
- Page 33 and 34: 1PRÉSENTATION DU GROUPE TF1Point s
- Page 35 and 36: 1PRÉSENTATION DU GROUPE TF1Point s
- Page 37 and 38: 1PRÉSENTATION DU GROUPE TF1Point s
- Page 39 and 40: 1PRÉSENTATION DU GROUPE TF1Point s
- Page 41 and 42: 1PRÉSENTATION DU GROUPE TF1Point s
- Page 43 and 44: RAPPORT DUPRÉSIDENT DU CONSEILD’
- Page 45 and 46: 2RAPPORT DU PRÉSIDENT DU CONSEIL D
- Page 47 and 48: 2RAPPORT DU PRÉSIDENT DU CONSEIL D
- Page 49 and 50: 2RAPPORT DU PRÉSIDENT DU CONSEIL D
- Page 51 and 52: 2RAPPORT DU PRÉSIDENT DU CONSEIL D
- Page 53 and 54: 2RAPPORT DU PRÉSIDENT DU CONSEIL D
- Page 55 and 56: 2RAPPORT DU PRÉSIDENT DU CONSEIL D
- Page 57 and 58: 2RAPPORT DU PRÉSIDENT DU CONSEIL D
- Page 59 and 60: 2RAPPORT DU PRÉSIDENT DU CONSEIL D
- Page 61 and 62: 2RAPPORT DU PRÉSIDENT DU CONSEIL D
- Page 63 and 64: 2RAPPORT DU PRÉSIDENT DU CONSEIL D
- Page 65 and 66: 2RAPPORT DU PRÉSIDENT DU CONSEIL D
- Page 67 and 68: 2RAPPORT DU PRÉSIDENT DU CONSEIL D
- Page 69 and 70: 2RAPPORT DU PRÉSIDENT DU CONSEIL D
- Page 71 and 72:
2RAPPORT DU PRÉSIDENT DU CONSEIL D
- Page 73 and 74:
2RAPPORT DU PRÉSIDENT DU CONSEIL D
- Page 75 and 76:
2RAPPORT DU PRÉSIDENT DU CONSEIL D
- Page 77 and 78:
2RAPPORT DU PRÉSIDENT DU CONSEIL D
- Page 79 and 80:
2RAPPORT DU PRÉSIDENT DU CONSEIL D
- Page 81 and 82:
RAPPORT DEGESTION DU CONSEILD’ADM
- Page 83 and 84:
3RAPPORT DE GESTION DU CONSEIL D’
- Page 85 and 86:
3RAPPORT DE GESTION DU CONSEIL D’
- Page 87 and 88:
3RAPPORT DE GESTION DU CONSEIL D’
- Page 89 and 90:
3RAPPORT DE GESTION DU CONSEIL D’
- Page 91 and 92:
3RAPPORT DE GESTION DU CONSEIL D’
- Page 93 and 94:
3RAPPORT DE GESTION DU CONSEIL D’
- Page 95 and 96:
3RAPPORT DE GESTION DU CONSEIL D’
- Page 97 and 98:
3RAPPORT DE GESTION DU CONSEIL D’
- Page 99 and 100:
3RAPPORT DE GESTION DU CONSEIL D’
- Page 101 and 102:
3RAPPORT DE GESTION DU CONSEIL D’
- Page 103 and 104:
3RAPPORT DE GESTION DU CONSEIL D’
- Page 105 and 106:
3RAPPORT DE GESTION DU CONSEIL D’
- Page 107 and 108:
3RAPPORT DE GESTION DU CONSEIL D’
- Page 109 and 110:
3RAPPORT DE GESTION DU CONSEIL D’
- Page 111 and 112:
3RAPPORT DE GESTION DU CONSEIL D’
- Page 113 and 114:
3RAPPORT DE GESTION DU CONSEIL D’
- Page 115 and 116:
4ÉTATS FINANCIERS 20104.1 COMPTES
- Page 117 and 118:
4ÉTATS FINANCIERS 2010Comptes cons
- Page 119 and 120:
4ÉTATS FINANCIERS 2010Comptes cons
- Page 121 and 122:
ÉTATS FINANCIERS 20104Annexes des
- Page 123 and 124:
ÉTATS FINANCIERS 20104Annexes des
- Page 125 and 126:
ÉTATS FINANCIERS 20104Annexes des
- Page 127 and 128:
ÉTATS FINANCIERS 20104Annexes des
- Page 129 and 130:
ÉTATS FINANCIERS 20104Annexes des
- Page 131 and 132:
ÉTATS FINANCIERS 20104Annexes des
- Page 133 and 134:
ÉTATS FINANCIERS 20104Annexes des
- Page 135 and 136:
ÉTATS FINANCIERS 20104Annexes des
- Page 137 and 138:
ÉTATS FINANCIERS 20104Annexes des
- Page 139 and 140:
ÉTATS FINANCIERS 20104Annexes des
- Page 141 and 142:
ÉTATS FINANCIERS 20104Annexes des
- Page 143 and 144:
ÉTATS FINANCIERS 20104Annexes des
- Page 145 and 146:
ÉTATS FINANCIERS 20104Annexes des
- Page 147 and 148:
ÉTATS FINANCIERS 20104Annexes des
- Page 149 and 150:
ÉTATS FINANCIERS 20104Annexes des
- Page 151 and 152:
ÉTATS FINANCIERS 20104Annexes des
- Page 153 and 154:
ÉTATS FINANCIERS 20104Annexes des
- Page 155 and 156:
ÉTATS FINANCIERS 20104Annexes des
- Page 157 and 158:
ÉTATS FINANCIERS 20104Annexes des
- Page 159 and 160:
ÉTATS FINANCIERS 20104Annexes des
- Page 161 and 162:
ÉTATS FINANCIERS 20104Annexes des
- Page 163 and 164:
ÉTATS FINANCIERS 20104Annexes des
- Page 165 and 166:
ÉTATS FINANCIERS 20104Annexes des
- Page 167 and 168:
ÉTATS FINANCIERS 20104Annexes des
- Page 169 and 170:
ÉTATS FINANCIERS 20104Annexes des
- Page 171 and 172:
ÉTATS FINANCIERS 20104Annexes des
- Page 173 and 174:
ÉTATS FINANCIERS 20104Annexes des
- Page 175 and 176:
ÉTATS FINANCIERS 20104Annexes des
- Page 177 and 178:
4ÉTATS FINANCIERS 2010Comptes indi
- Page 179 and 180:
4ÉTATS FINANCIERS 2010Comptes indi
- Page 181 and 182:
ÉTATS FINANCIERS 20104Annexes des
- Page 183 and 184:
ÉTATS FINANCIERS 20104Annexes des
- Page 185 and 186:
ÉTATS FINANCIERS 20104Annexes des
- Page 187 and 188:
ÉTATS FINANCIERS 20104Annexes des
- Page 189 and 190:
ÉTATS FINANCIERS 20104Annexes des
- Page 191 and 192:
ÉTATS FINANCIERS 20104Annexes des
- Page 193 and 194:
ÉTATS FINANCIERS 20104Annexes des
- Page 195 and 196:
ÉTATS FINANCIERS 20104Annexes des
- Page 197 and 198:
RAPPORTS DESCOMMISSAIRESAUX COMPTES
- Page 199 and 200:
RAPPORTS DES COMMISSAIRES AUX COMPT
- Page 201 and 202:
RAPPORTS DES COMMISSAIRES AUX COMPT
- Page 203 and 204:
RAPPORTS DES COMMISSAIRES AUX COMPT
- Page 205 and 206:
RAPPORTS DES COMMISSAIRES AUX COMPT
- Page 207 and 208:
RAPPORTS DES COMMISSAIRES AUX COMPT
- Page 209 and 210:
RAPPORTS DES COMMISSAIRES AUX COMPT
- Page 211 and 212:
6INFORMATIONS SUR LASOCIÉTÉ ET LE
- Page 213 and 214:
6INFORMATIONS SUR LA SOCIÉTÉ ET L
- Page 215 and 216:
6INFORMATIONS SUR LA SOCIÉTÉ ET L
- Page 217 and 218:
6INFORMATIONS SUR LA SOCIÉTÉ ET L
- Page 219 and 220:
6INFORMATIONS SUR LA SOCIÉTÉ ET L
- Page 221 and 222:
6INFORMATIONS SUR LA SOCIÉTÉ ET L
- Page 223 and 224:
6INFORMATIONS SUR LA SOCIÉTÉ ET L
- Page 225 and 226:
6INFORMATIONS SUR LA SOCIÉTÉ ET L
- Page 227 and 228:
6INFORMATIONS SUR LA SOCIÉTÉ ET L
- Page 229 and 230:
6INFORMATIONS SUR LA SOCIÉTÉ ET L
- Page 231 and 232:
6INFORMATIONS SUR LA SOCIÉTÉ ET L
- Page 233 and 234:
6INFORMATIONS SUR LA SOCIÉTÉ ET L
- Page 235 and 236:
7ASSEMBLÉE GÉNÉRALE7.1 PARTICIPA
- Page 237 and 238:
ASSEMBLÉE GÉNÉRALE7Participation
- Page 239 and 240:
ASSEMBLÉE GÉNÉRALE7Rapport du Co
- Page 241 and 242:
ASSEMBLÉE GÉNÉRALE7Rapport du Co
- Page 243 and 244:
ASSEMBLÉE GÉNÉRALE7Rapport du Co
- Page 245 and 246:
ASSEMBLÉE GÉNÉRALE7Présentation
- Page 247 and 248:
ASSEMBLÉE GÉNÉRALE7Présentation
- Page 249 and 250:
ASSEMBLÉE GÉNÉRALE7Présentation
- Page 251 and 252:
ASSEMBLÉE GÉNÉRALE7Présentation
- Page 253 and 254:
ASSEMBLÉE GÉNÉRALE7Présentation
- Page 255 and 256:
ASSEMBLÉE GÉNÉRALE7Présentation
- Page 257 and 258:
ASSEMBLÉE GÉNÉRALE7Présentation
- Page 259 and 260:
8INFORMATIONSCOMPLÉMENTAIRES8.1 RE
- Page 261 and 262:
INFORMATIONS COMPLÉMENTAIRES8Respo
- Page 263 and 264:
INFORMATIONS COMPLÉMENTAIRES8Adres
- Page 265 and 266:
INFORMATIONS COMPLÉMENTAIRES8Table
- Page 267 and 268:
Le document de référence est disp


