SIERRA LEONE maq 4ª.indd - agrilife - Europa
SIERRA LEONE maq 4ª.indd - agrilife - Europa
SIERRA LEONE maq 4ª.indd - agrilife - Europa

You also want an ePaper? Increase the reach of your titles
YUMPU automatically turns print PDFs into web optimized ePapers that Google loves.
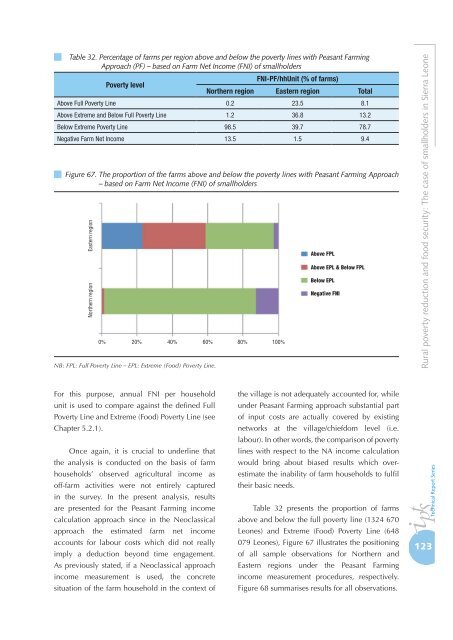
Table 32. Percentage of farms per region above and below the poverty lines with Peasant Farming<br />
Approach (PF) – based on Farm Net Income (FNI) of smallholders<br />
Poverty level<br />
FNI-PF/hhUnit (% of farms)<br />
Northern region Eastern region Total<br />
Above Full Poverty Line 0.2 23.5 8.1<br />
Above Extreme and Below Full Poverty Line 1.2 36.8 13.2<br />
Below Extreme Poverty Line 98.5 39.7 78.7<br />
Negative Farm Net Income 13.5 1.5 9.4<br />
Figure 67. The proportion of the farms above and below the poverty lines with Peasant Farming Approach<br />
– based on Farm Net Income (FNI) of smallholders<br />
NB: FPL: Full Poverty Line – EPL: Extreme (Food) Poverty Line.<br />
For this purpose, annual FNI per household<br />
unit is used to compare against the defined Full<br />
Poverty Line and Extreme (Food) Poverty Line (see<br />
Chapter 5.2.1).<br />
Once again, it is crucial to underline that<br />
the analysis is conducted on the basis of farm<br />
households’ observed agricultural income as<br />
off-farm activities were not entirely captured<br />
in the survey. In the present analysis, results<br />
are presented for the Peasant Farming income<br />
calculation approach since in the Neoclassical<br />
approach the estimated farm net income<br />
accounts for labour costs which did not really<br />
imply a deduction beyond time engagement.<br />
As previously stated, if a Neoclassical approach<br />
income measurement is used, the concrete<br />
situation of the farm household in the context of<br />
the village is not adequately accounted for, while<br />
under Peasant Farming approach substantial part<br />
of input costs are actually covered by existing<br />
networks at the village/chiefdom level (i.e.<br />
labour). In other words, the comparison of poverty<br />
lines with respect to the NA income calculation<br />
would bring about biased results which overestimate<br />
the inability of farm households to fulfil<br />
their basic needs.<br />
Table 32 presents the proportion of farms<br />
above and below the full poverty line (1324 670<br />
Leones) and Extreme (Food) Poverty Line (648<br />
079 Leones), Figure 67 illustrates the positioning<br />
of all sample observations for Northern and<br />
Eastern regions under the Peasant Farming<br />
income measurement procedures, respectively.<br />
Figure 68 summarises results for all observations.<br />
Rural poverty reduction and food security: The case of smallholders in Sierra Leone<br />
123