- Page 3 and 4: Rural poverty reduction and food se
- Page 5 and 6: Table of Contents Acknowledgments 2
- Page 7 and 8: 7 Conclusions 157 7.1 Surveyed Smal
- Page 9 and 10: Table 31. Different output values a
- Page 11 and 12: Figure 34. Local participation in t
- Page 13 and 14: Figure 96. Change in income as a re
- Page 15 and 16: Executive Summary Agriculture is es
- Page 17: attention needs to be paid to the i
- Page 20 and 21: 1 Introduction 18 Box 1: Food Secur
- Page 23 and 24: 2 Description of the Context in Sie
- Page 25 and 26: Figure 2. Structure of the populati
- Page 27 and 28: Diseases such as malaria and tuberc
- Page 29 and 30: to energy supplies 8 , a low-skille
- Page 31: Figure 4. Composition of exports fr
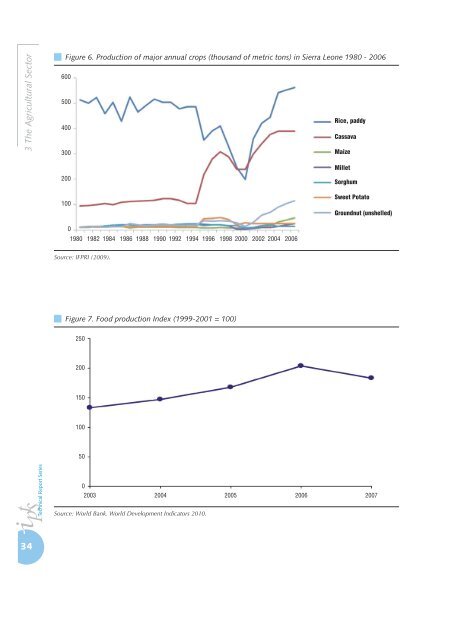
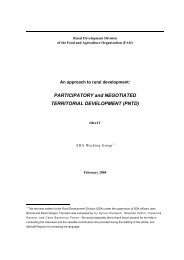
- Page 34 and 35: 3 The Agricultural Sector 32 agrari
- Page 38 and 39: 3 The Agricultural Sector 36 Figure
- Page 40 and 41: 3 The Agricultural Sector 38 3.1.2
- Page 42 and 43: 3 The Agricultural Sector 40 scale
- Page 44 and 45: 3 The Agricultural Sector 42 absorb
- Page 46 and 47: 3 The Agricultural Sector 44 Figure
- Page 48 and 49: 3 The Agricultural Sector 46 availa
- Page 50 and 51: 3 The Agricultural Sector 48 and in
- Page 52 and 53: 3 The Agricultural Sector 50 origin
- Page 54 and 55: 3 The Agricultural Sector 52 The us
- Page 56 and 57: 3 The Agricultural Sector 54 crops
- Page 58 and 59: 3 The Agricultural Sector 56 • Se
- Page 60 and 61: 3 The Agricultural Sector 58 severe
- Page 62 and 63: 3 The Agricultural Sector 60 Figure
- Page 64 and 65: 3 The Agricultural Sector 62 Table
- Page 66 and 67: 3 The Agricultural Sector 64 Table
- Page 68 and 69: 3 The Agricultural Sector 66 post-h
- Page 70 and 71: 4 EU Support Programmes for Rice an
- Page 72 and 73: 4 EU Support Programmes for Rice an
- Page 75 and 76: 5 Survey Methodology In this sectio
- Page 77 and 78: sampling techniques were employed t
- Page 79 and 80: up an agrarian system. The househol
- Page 81 and 82: Farm Net Income per working unit: D
- Page 83 and 84: price, which is higher than the mar
- Page 85 and 86: stock or exchanges at the village l
- Page 87 and 88:
= 0.72) for non-food requirements.
- Page 89 and 90:
6 Survey Results This section addre
- Page 91 and 92:
6.1.2 Main activities and income so
- Page 93 and 94:
Figure 24. Average acreage under cu
- Page 95 and 96:
Table 24. Resources of smallholders
- Page 97 and 98:
Figure 30. Total acre per household
- Page 99 and 100:
harvesting period (Sesay et al., 20
- Page 101 and 102:
Figure 34. Local participation in t
- Page 103 and 104:
improved management strategies at p
- Page 105 and 106:
Figure 41. Crop mix categories in t
- Page 107 and 108:
when analysing the smallholder viab
- Page 109 and 110:
Table 27. Economic results of the s
- Page 111 and 112:
Table 29. Economic results of the s
- Page 113 and 114:
Figure 47. Farm Net Income for an a
- Page 115 and 116:
hired labour costs for self-subsist
- Page 117 and 118:
Figure 52. Output value of rice per
- Page 119 and 120:
Figure 57. Distribution of tree cro
- Page 121 and 122:
Figure 60. Farm viability of smallh
- Page 123 and 124:
Figure 63. Farm viability per farm
- Page 125 and 126:
Table 32. Percentage of farms per r
- Page 127 and 128:
Figure 69. Poverty level per farm t
- Page 129 and 130:
Figure 72. Cocoa and coffee output
- Page 131 and 132:
Figure 76. Total labour productivit
- Page 133 and 134:
Figure 80. Labour productivity per
- Page 135 and 136:
Figure 83. Labour productivity per
- Page 137 and 138:
6.4 Evaluation of the influence of
- Page 139 and 140:
Table 33. Evaluation Matrix for Sup
- Page 141 and 142:
Figure 87. Adequacy of support prov
- Page 143 and 144:
Figure 91. Adequacy of support prov
- Page 145 and 146:
Figure 95. Change in income as a re
- Page 147 and 148:
Figure 97. Impact of support on dif
- Page 149 and 150:
Figure 100. Expected sustainability
- Page 151 and 152:
Figure 103. Average farm net income
- Page 153 and 154:
Figure 107. Cultivated area of non-
- Page 155 and 156:
Figure 111. Revelance of income sou
- Page 157:
Figure 115. Number of tractors hire
- Page 160 and 161:
7 Conclusions 158 Table 34. Basic C
- Page 162 and 163:
7 Conclusions 160 Under the Peasant
- Page 164 and 165:
7 Conclusions 162 In the Eastern di
- Page 166 and 167:
7 Conclusions 164 may actually bene
- Page 168 and 169:
7 Conclusions 166 determining the d
- Page 170 and 171:
8 References 168 Crowley, E.L. (199
- Page 172 and 173:
8 References 170 GoSL and EC Govern
- Page 174 and 175:
8 References 172 Moreau P., F. Mabo
- Page 176 and 177:
8 References 174 van Wesenbeeck C.F
- Page 178 and 179:
9 Appendices 176 HOUSEHOLD DEMOGRAP
- Page 180 and 181:
9 Appendices 178 COMMUNITY LEADERSH
- Page 182 and 183:
9 Appendices 180 Planting materials
- Page 184 and 185:
9 Appendices 182 Could you explain
- Page 186 and 187:
9 Appendices 184 Externality Please
- Page 188 and 189:
9 Appendices 186 Infrastructure/com
- Page 190 and 191:
9 Appendices 188 LABOUR INPUT- FOOD
- Page 192 and 193:
9 Appendices 190 OTHER INPUTS QUANT
- Page 194 and 195:
9 Appendices 192 YIELD LOSSES Now w
- Page 196 and 197:
9 Appendices 194 Figure: % of farms
- Page 198 and 199:
9 Appendices 196 Figure: Average fa
- Page 200 and 201:
9 Appendices 198 Labour productivit
- Page 202 and 203:
9 Appendices 200 Labour productivit
- Page 204 and 205:
9 Appendices 202