SIERRA LEONE maq 4ª.indd - agrilife - Europa
SIERRA LEONE maq 4ª.indd - agrilife - Europa
SIERRA LEONE maq 4ª.indd - agrilife - Europa

Create successful ePaper yourself
Turn your PDF publications into a flip-book with our unique Google optimized e-Paper software.
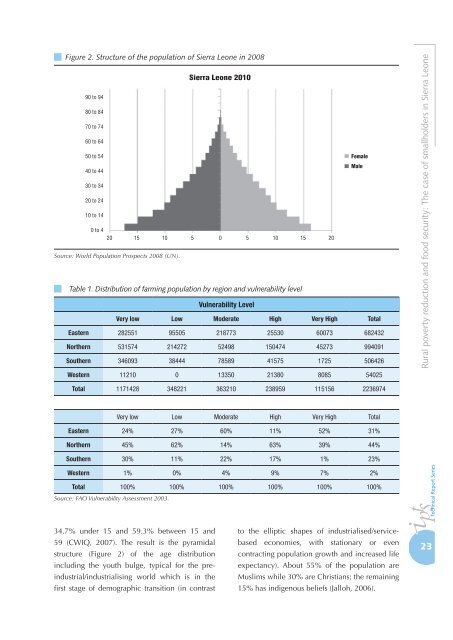
Figure 2. Structure of the population of Sierra Leone in 2008<br />
Source: World Population Prospects 2008 (UN).<br />
Table 1. Distribution of farming population by region and vulnerability level<br />
34.7% under 15 and 59.3% between 15 and<br />
59 (CWIQ, 2007). The result is the pyramidal<br />
structure (Figure 2) of the age distribution<br />
including the youth bulge, typical for the preindustrial/industrialising<br />
world which is in the<br />
first stage of demographic transition (in contrast<br />
Vulnerability Level<br />
Very low Low Moderate High Very High Total<br />
Eastern 282551 95505 218773 25530 60073 682432<br />
Northern 531574 214272 52498 150474 45273 994091<br />
Southern 346093 38444 78589 41575 1725 506426<br />
Western 11210 0 13350 21380 8085 54025<br />
Total 1171428 348221 363210 238959 115156 2236974<br />
Very low Low Moderate High Very High Total<br />
Eastern 24% 27% 60% 11% 52% 31%<br />
Northern 45% 62% 14% 63% 39% 44%<br />
Southern 30% 11% 22% 17% 1% 23%<br />
Western 1% 0% 4% 9% 7% 2%<br />
Total 100% 100% 100% 100% 100% 100%<br />
Source: FAO Vulnerability Assessment 2003.<br />
to the elliptic shapes of industrialised/servicebased<br />
economies, with stationary or even<br />
contracting population growth and increased life<br />
expectancy). About 55% of the population are<br />
Muslims while 30% are Christians; the remaining<br />
15% has indigenous beliefs (Jalloh, 2006).<br />
Rural poverty reduction and food security: The case of smallholders in Sierra Leone<br />
23