SIERRA LEONE maq 4ª.indd - agrilife - Europa
SIERRA LEONE maq 4ª.indd - agrilife - Europa
SIERRA LEONE maq 4ª.indd - agrilife - Europa

Create successful ePaper yourself
Turn your PDF publications into a flip-book with our unique Google optimized e-Paper software.
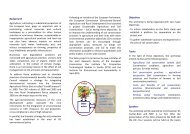
Table 5. National Rice Production and Self-sufficiency (1997 – 2008) - Sierra Leone<br />
Year<br />
Area<br />
(Ha)<br />
Yield<br />
(Mt/Ha)<br />
Production<br />
(Mt)<br />
15 MAFFS website accessed on 04/05/10 http://www.<br />
agriculture.gov.sl/AgricDatabase/AgricStatistics/tabid/96/<br />
Default.aspx<br />
Milled<br />
Equivalent<br />
(Mt)<br />
Population<br />
National<br />
Requirement<br />
(Mt Milled)<br />
Self-<br />
Sufficiency<br />
(%)<br />
1997 360.789 1,14 411.300 246.780 4.382.360 455.765 54,15<br />
1998 320.517 1,16 371.800 223.080 4.465.625 464.425 48,03<br />
1999 212.137 1,17 248.200 148.920 4.550.472 473.249 31,47<br />
2000 166.387 1,19 198.000 118.800 4.636.931 482.241 24,63<br />
2001 258.850 1,20 310.620 186.372 4.725.033 491.403 37,93<br />
2002 343.142 1,23 422.065 253.239 4.814.808 500.740 50,57<br />
2003 356.506 1,25 445.633 267.380 4.906.290 510.254 52,40<br />
2004 426.772 1,27 542.000 325.200 4.999.509 519.949 62,54<br />
2005 427.907 1,29 552.000 331.200 5.094.500 529.828 62,51<br />
2006 422.556 1,33 562.000 337.200 5.216.890 542.557 62,15<br />
2007 432.356 1,36 588.004 352.802 5.343.200 555.693 63,49<br />
2008 475.592 1,43 680.097 408.058 5.473.530 569.247 71,68<br />
Source: MAFFS.<br />
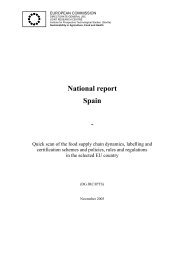
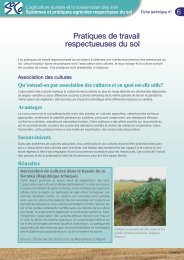
Figure 8. Sierra Leone rice production and requirement in metric tons<br />
Note: 2009 - 2015 figures are projections.<br />
Source: EDS (2009).<br />
Rural poverty reduction and food security: The case of smallholders in Sierra Leone<br />
35