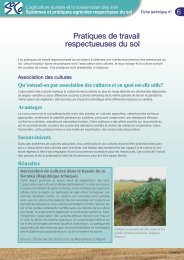
SIERRA LEONE maq 4ª.indd - agrilife - Europa
SIERRA LEONE maq 4ª.indd - agrilife - Europa
SIERRA LEONE maq 4ª.indd - agrilife - Europa

You also want an ePaper? Increase the reach of your titles
YUMPU automatically turns print PDFs into web optimized ePapers that Google loves.
6 Survey Results<br />
124<br />
Figure 68. Poverty level per household based on Peasant Farming Approach (only agricultural income is<br />
accounted for)<br />
Under the PF approach, 79% of the farms fall<br />
below the Extreme (Food) Poverty Line, meaning<br />
that these farm households are “food poor”.<br />
However, it should be stressed that only income<br />
the household gets from the agricultural production<br />
is considered, and no other income sources were<br />
integrated into the computation. The latter implies<br />
that that most of the household cannot sustain their<br />
consumption based on their agricultural production<br />
alone (even when relying on the village-level<br />
arrangements to secure labour and other inputs),<br />
and thus, these farm households depend on other<br />
income sources for their self subsistence.<br />
The poverty level per farm type is illustrated<br />
in Figure 69 for the Peasant Farming approach.<br />
To recapitulate, farm type (FT) 1 to 5 are located<br />
in the Northern districts of Bombali and Tonkolili<br />
and their crop orientation extends from rice only<br />
to a combination of rice and other food crops<br />
and non-cash tree crops to only non-cash or<br />
subsistence tree crops. Farm types 6 to 8 are those<br />
located in the east and their crop orientation<br />
moves from highly diversified (with FT 6 and 7<br />
cultivating cash and non-cash tree crops, upland<br />
and lowland rice, and other food crops) to farms<br />
of type FT8 largely under tree crop production<br />
(mainly cash crop).<br />
Figure 69 shows that the farm types situated<br />
mainly in the Northern region with production<br />
orientation on self sufficiency and without cash<br />
crops are receiving income from agriculture that is<br />
not sufficient to fulfil their self subsistence needs.<br />
On the other hand, farms engaged in cash tree<br />
cropping are better positioned to cover the basic<br />
food needs. These results also suggest that farms<br />
with bigger area per household in the Eastern<br />
districts do cover more of their self-sufficient<br />
needs than farm households with smaller<br />
disposable area in the Northern districts. Figure<br />
68 also shows that below 2 acres of available<br />
land per household unit the vast majority of the<br />
farm types are extremely poor. However, farm<br />
types with cash crop orientation disposing of<br />
more than 2 acres per household unit fall above<br />
the Extreme (Food) Poverty Line. This supports the<br />
idea that land availability and product orientation<br />
(diversification strategies) are relevant issues to be<br />
considered by the policy in the study area.<br />
Thus, both the farm crop orientation and the<br />
size do play an important role in the food security<br />
of the households. However, the decision to<br />
alter the underlying crop mix is not directly in<br />
the hands of farms. Clearly, the agro-ecological<br />
setting does not allow for the extensive cultivation