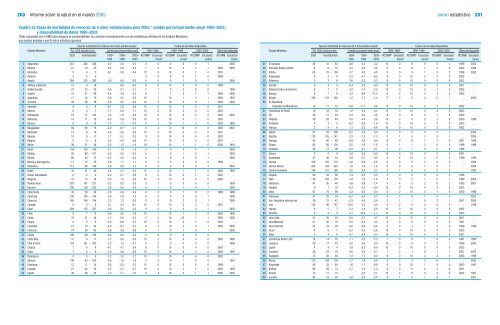
200 <strong>Informe</strong> <strong>sobre</strong> <strong>la</strong> <strong>salud</strong> <strong>en</strong> <strong>el</strong> <strong>mundo</strong> <strong>2005</strong>anexo estadístico 201Cuadro 2a Tasas de mortalidad de m<strong>en</strong>ores de 5 años: estimaciones para 2003, a cambio porc<strong>en</strong>tual medio anual 1990–2003,y disponibilidad de datos 1980–2003Cifras calcu<strong>la</strong>das por <strong>la</strong> OMS para asegurar <strong>la</strong> comparabilidad; no coincid<strong>en</strong> necesariam<strong>en</strong>te con <strong>la</strong>s estadísticas oficiales de los Estados Miembros,que pued<strong>en</strong> emplear a ese fin otros métodos rigurosos.Tasa de mortalidad de m<strong>en</strong>ores de 5 años (ambos sexos) aFu<strong>en</strong>te de los datos disponiblesEstado Miembro Por 1000 nacidos vivos Cambio porc<strong>en</strong>tual medio anual 1980–1989 1990–1999 2000–2003 Último año disponible2003 Incertidumbre 1990– 1995– 2000– RC/SRM b Encuesta/ RC/SRM b Encuesta/ RC/SRM b Encuesta/ RC/SRM Encuesta/1994 1999 2003 C<strong>en</strong>so c C<strong>en</strong>so c C<strong>en</strong>so c C<strong>en</strong>so1 Afganistán 257 206 - 308 -0,2 0,0 0,0 0 0 0 0 0 1 … 20002 Albania 21 19 - 23 -5,5 -5,9 -6,0 7 0 10 0 4 1 2003 20003 Alemania 5 4 - 5 -6,1 -3,9 -4,4 10 0 10 0 2 0 2001 …4 Andorra 5 5 - 6 … … … 0 0 6 0 1 0 2000 …5 Ango<strong>la</strong> 260 225 - 293 0,0 0,0 0,0 0 0 0 1 0 1 … 20006 Antigua y Barbuda 12 9 - 16 … -6,5 -6,5 6 0 10 0 0 0 1999 …7 Arabia Saudita 27 23 - 33 -5,0 -3,1 -3,1 0 1 0 2 0 0 … 19968 Arg<strong>el</strong>ia 41 31 - 49 -4,4 -3,9 -3,2 6 1 1 2 1 1 2000 20009 Arg<strong>en</strong>tina 17 16 - 19 -3,9 -4,5 -3,5 10 1 10 1 3 1 2002 199110 Arm<strong>en</strong>ia 33 29 - 38 -4,0 -5,5 -3,3 10 0 10 0 4 1 2003 200011 Australia 6 5 - 6 -6,1 -2,2 -3,6 10 0 10 0 2 0 2001 …12 Austria 6 4 - 7 -7,1 -2,9 -1,1 10 0 10 0 4 0 2003 …13 Azerbaiyán 91 77 - 104 -1,4 -1,0 -0,9 10 0 10 0 3 2 2002 200114 Bahamas 14 11 - 18 -4,5 -5,9 -5,9 10 0 10 0 1 0 2000 …15 Bahrein 9 8 - 10 -1,7 -1,7 -17,3 9 1 10 1 3 0 2002 199516 Bang<strong>la</strong>desh 69 65 - 75 -4,2 -6,7 -5,7 6 4 0 13 0 2 1987 200117 Barbados 13 8 - 18 0,0 -2,6 -2,6 10 0 10 0 2 0 2001 …18 Be<strong>la</strong>rús 10 9 - 11 1,7 -5,1 -7,0 9 0 10 0 4 0 2003 …19 Bélgica 5 5 - 6 -5,3 -4,0 -5,6 10 0 10 0 2 0 2001 …20 B<strong>el</strong>ice 39 31 - 48 -2,2 -1,4 -1,4 10 0 10 1 1 0 2000 199121 B<strong>en</strong>in 154 139 - 169 -1,7 -1,2 -1,2 0 2 0 2 0 1 … 200022 Bhután 85 68 - 101 -4,3 -5,5 -5,3 0 1 0 1 0 1 … 200023 Bolivia 66 60 - 73 -5,2 -4,0 -4,0 0 3 0 3 0 1 … 200024 Bosnia y Herzegovina 17 15 - 20 -2,9 -1,1 -1,1 5 0 3 0 0 0 1999 …25 Botswana 112 96 - 128 2,6 8,9 3,5 0 3 0 2 0 1 … 200026 Brasil 35 31 - 40 -4,4 -4,1 -3,2 10 4 10 1 1 0 2000 199627 Brunei Darussa<strong>la</strong>m 6 5 - 6 -4,0 -5,7 -5,8 8 0 10 0 1 0 2000 …28 Bulgaria 15 14 - 16 -0,3 -1,5 -2,8 10 0 10 0 4 0 2003 …29 Burkina Faso 207 187 - 227 -0,3 0,0 0,0 0 1 0 5 0 0 … 199930 Burundi 190 159 - 222 0,0 0,0 0,0 0 1 0 1 0 1 … 200031 Cabo Verde 35 30 - 40 -3,5 -4,4 -4,4 4 0 3 1 0 0 1998 199832 Camboya 140 124 - 158 0,9 2,4 1,2 0 0 0 2 0 1 … 200033 Camerún 166 148 - 184 2,3 1,3 0,0 0 0 0 2 0 1 … 200034 Canadá 6 5 - 6 -3,1 -3,5 -2,1 10 0 10 0 2 0 2001 …35 Chad 200 175 - 227 -0,3 0,0 0,0 0 0 0 2 0 1 … 200036 Chile 9 7 - 12 -5,9 -3,0 -7,8 10 1 10 1 3 0 2002 199237 China 37 31 - 44 -1,3 -2,8 -2,5 2 5 10 22 1 1 2000 200038 Chipre 6 5 - 6 -6,0 -6,6 -3,7 10 0 10 0 3 0 2002 …39 Colombia 21 19 - 24 -4,2 -3,7 -3,7 8 3 10 2 3 1 2002 200040 Comoras 73 59 - 85 -3,6 -3,9 -3,9 0 1 0 1 0 1 … 200041 Congo 108 89 - 128 -0,4 0,0 0,0 0 0 0 0 0 0 … …42 Costa Rica 10 9 - 11 -1,2 -5,6 -5,6 10 3 10 0 3 0 2002 198643 Côte d’Ivoire 193 161 - 223 2,2 1,5 0,7 0 2 0 3 0 0 … 199844 Croacia 7 6 - 8 -4,7 -4,1 -2,4 8 0 10 0 4 0 2003 …45 Cuba 7 6 - 9 -3,0 -4,9 -6,8 10 2 10 0 3 0 2002 198746 Dinamarca 5 5 - 6 -7,2 -1,5 -1,7 10 0 10 0 4 0 2003 …47 Djibouti 138 93 - 183 -1,8 -1,8 -1,8 0 0 0 1 0 0 … 199148 Dominica 12 11 - 14 -2,6 -2,5 -2,3 10 0 10 0 0 0 1999 …49 Ecuador 27 24 - 30 -5,5 -5,7 -5,7 10 4 10 3 1 0 2000 199950 Egipto 39 36 - 43 -7,3 -7,1 -7,0 9 4 10 4 1 1 2000 2000Tasa de mortalidad de m<strong>en</strong>ores de 5 años (ambos sexos) aFu<strong>en</strong>te de los datos disponiblesEstado Miembro Por 1000 nacidos vivos Cambio porc<strong>en</strong>tual medio anual 1980–1989 1990–1999 2000–2003 Último año disponible2003 Incertidumbre 1990– 1995– 2000– RC/SRM b Encuesta/ RC/SRM b Encuesta/ RC/SRM b Encuesta/ RC/SRM Encuesta/1994 1999 2003 C<strong>en</strong>so c C<strong>en</strong>so c C<strong>en</strong>so c C<strong>en</strong>so51 El Salvador 36 31 - 42 -4,8 -3,2 -3,2 10 2 9 6 0 1 1999 200252 Emiratos Árabes Unidos 8 6 - 10 -4,7 -3,9 -3,9 0 2 8 1 3 0 2002 199553 Eritrea 85 70 - 100 -3,7 -4,5 -4,5 0 0 0 1 0 2 1999 200254 Eslovaquia 8 7 - 9 -2,5 -4,1 -6,5 8 0 10 0 3 0 2002 …55 Eslov<strong>en</strong>ia 5 3 - 6 -7,6 -3,5 -5,3 8 0 10 0 4 0 2003 …56 España 5 4 - 5 -6,4 -3,5 -6,0 10 0 10 0 2 0 2001 …57 Estados Unidos de América 8 7 - 9 -4,3 -1,4 -2,9 10 0 10 0 3 0 2002 …58 Estonia 8 7 - 9 3,2 -9,9 -11,5 9 0 10 0 3 0 2002 …59 Etiopía 169 133 - 202 -1,2 -1,7 -1,4 0 2 0 4 0 1 … 200060 Ex RepúblicaYugos<strong>la</strong>va de Macedonia 12 11 - 13 -6,0 -11,1 -3,6 8 0 10 0 3 0 2002 …61 Federación de Rusia 16 16 - 16 1,2 -2,4 -6,4 10 0 10 0 4 0 2003 …62 Fiji 20 17 - 24 -4,3 -2,5 -2,5 8 0 8 0 1 0 2000 …63 Filipinas 36 29 - 44 -4,5 -4,4 -3,6 10 2 9 2 1 0 2000 199864 Fin<strong>la</strong>ndia 4 3 - 5 -6,2 -2,6 -1,8 10 0 10 0 4 0 2003 …65 Francia 5 4 - 6 -7,1 -2,3 -4,6 10 0 10 0 3 0 2002 …66 Gabón 91 82 - 100 -0,2 0,0 0,0 0 0 0 0 0 1 … 200067 Gambia 123 105 - 141 -2,3 -1,3 -1,3 0 1 0 3 0 1 … 200068 Georgia 45 40 - 49 -0,9 0,0 0,0 9 0 9 1 2 0 2001 199969 Ghana 95 85 - 104 -2,5 -1,9 -1,6 0 1 1 3 0 0 1999 199870 Granada 23 17 - 28 -2,3 -4,7 -4,7 3 0 7 0 0 0 1996 …71 Grecia 6 5 - 6 -3,4 -5,3 -6,0 10 0 10 0 2 0 2001 …72 Guatema<strong>la</strong> 47 40 - 54 -4,8 -3,7 -3,9 9 4 10 2 0 0 1999 199973 Guinea 160 145 - 175 -2,8 -3,4 -2,9 0 0 0 2 0 0 … 199974 Guinea-Bissau 204 183 - 224 -1,5 -1,8 -1,8 0 0 0 1 0 1 … 200075 Guinea Ecuatorial 146 121 - 169 -3,2 -2,3 -2,3 0 1 0 0 0 0 … 198376 Guyana 69 42 - 96 -1,4 -2,5 -2,5 3 0 5 0 0 0 1996 …77 Haití 119 102 - 135 -1,8 -1,8 -1,8 3 3 2 1 0 1 1999 200078 Honduras 41 36 - 46 -3,6 -2,6 -1,4 4 4 0 2 0 2 1983 200179 Hungría 9 7 - 10 -6,3 -2,2 -8,0 10 0 10 0 4 0 2003 …80 India 87 76 - 99 -3,3 -2,0 -2,4 0 2 10 2 1 0 2000 199881 Indonesia 41 32 - 54 -6,2 -6,2 -5,3 0 2 0 7 0 3 … 200282 Irán, República Islámica deI 39 31 - 47 -5,3 -4,4 -3,8 2 1 1 9 2 1 2001 200083 Iraq 125 96 - 157 19,5 0,5 0,0 0 2 0 4 0 0 … 199984 Ir<strong>la</strong>nda 6 5 - 7 -5,3 -1,4 -5,9 10 0 10 0 4 0 2003 …85 Is<strong>la</strong>ndia 3 3 - 4 -3,1 -10,2 -1,7 10 0 10 0 4 0 2003 …86 Is<strong>la</strong>s Cook 21 20 - 23 -2,0 -3,7 -3,7 10 0 10 0 2 0 2001 …87 Is<strong>la</strong>s Marshall 61 50 - 72 -2,5 -3,4 -3,4 4 0 8 0 0 0 1997 …88 Is<strong>la</strong>s Salomón 22 18 - 26 -3,6 -3,6 -3,6 0 0 3 1 0 0 1999 199989 Isra<strong>el</strong> 6 6 - 7 -6,7 -4,3 -2,6 10 0 10 0 4 0 2003 …90 Italia 5 4 - 6 -4,7 -6,4 -3,3 10 0 10 0 2 0 2001 …91 Jamahiriya Árabe Libia 16 14 - 18 -7,1 -7,2 -7,2 1 0 0 1 0 0 1981 199592 Jamaica 20 17 - 23 0,0 0,0 0,0 10 2 6 0 0 1 1999 200093 Japón 4 4 - 4 -1,6 -5,3 -4,0 10 0 10 0 4 0 2003 …94 Jordania 28 22 - 34 -2,6 -3,0 -2,7 1 2 1 6 1 1 2001 200295 Kazajstán 73 56 - 90 1,3 1,7 0,0 9 0 10 2 4 0 2003 199996 K<strong>en</strong>ya 123 108 - 138 2,7 1,6 0,8 0 3 0 3 0 1 … 200397 Kirguistán 68 53 - 84 -1,6 -1,1 -0,9 9 0 10 1 4 0 2003 199798 Kiribati 66 58 - 74 -2,7 -1,9 -1,9 0 0 9 0 2 0 2001 …99 Kuwait 12 11 - 13 … -4,0 2,1 10 2 9 0 4 0 2003 1987100 Lesotho 84 74 - 95 -3,0 -2,4 -2,4 0 1 0 1 0 1 … 2001
202 <strong>Informe</strong> <strong>sobre</strong> <strong>la</strong> <strong>salud</strong> <strong>en</strong> <strong>el</strong> <strong>mundo</strong> <strong>2005</strong>anexo estadístico 203Cuadro 2a Tasas de mortalidad de m<strong>en</strong>ores de 5 años: estimaciones para 2003, a cambio porc<strong>en</strong>tual medio anual 1990–2003,y disponibilidad de datos 1980–2003Cifras calcu<strong>la</strong>das por <strong>la</strong> OMS para asegurar <strong>la</strong> comparabilidad; no coincid<strong>en</strong> necesariam<strong>en</strong>te con <strong>la</strong>s estadísticas oficiales de los Estados Miembros,que pued<strong>en</strong> emplear a ese fin otros métodos rigurosos.Tasa de mortalidad de m<strong>en</strong>ores de 5 años (ambos sexos) aFu<strong>en</strong>te de los datos disponiblesEstado Miembro Por 1000 nacidos vivos Cambio porc<strong>en</strong>tual medio anual 1980–1989 1990–1999 2000–2003 Último año disponible2003 Incertidumbre 1990– 1995– 2000– RC/SRM b Encuesta/ RC/SRM b Encuesta/ RC/SRM b Encuesta/ RC/SRM Encuesta/1994 1999 2003 C<strong>en</strong>so c C<strong>en</strong>so c C<strong>en</strong>so c C<strong>en</strong>so101 Letonia 13 10 - 15 3,7 -9,2 -1,1 10 0 10 0 4 0 2003 …102 Líbano 31 27 - 35 -1,7 -1,2 -1,2 0 0 3 1 0 1 1999 2000103 Liberia 235 177 - 310 0,0 0,0 0,0 0 1 0 0 0 0 … 1986104 Lituania 9 7 - 10 2,8 -6,4 -8,0 9 0 10 0 4 0 2003 …105 Luxemburgo 4 4 - 6 -11,1 -0,3 -5,4 10 0 10 0 4 0 2003 …106 Madagascar 126 109 - 143 -1,5 -2,6 -2,7 0 0 0 2 0 1 … 2000107 Ma<strong>la</strong>sia 7 6 - 8 -9,7 -6,5 -6,5 8 0 10 0 1 0 2000 …108 Ma<strong>la</strong>wi 178 157 - 201 -2,2 -2,7 -1,7 0 3 0 2 0 1 … 2000109 Maldivas 72 63 - 81 -3,8 -3,4 -3,4 10 0 10 0 4 0 2003 …110 Malí 220 180 - 260 -1,4 -0,8 -0,5 0 2 0 1 0 2 … 2001111 Malta 6 5 - 7 -0,4 -8,2 -4,7 10 0 10 0 3 0 2002 …112 Marruecos 39 32 - 45 -6,4 -5,5 -5,5 0 4 8 3 0 1 1998 1997113 Mauricio 17 11 - 23 -1,7 -3,4 -2,9 10 0 10 0 3 0 2002 …114 Mauritania 184 161 - 207 0,0 0,0 0,0 0 2 0 2 0 2 … 2001115 México 28 24 - 32 -4,6 -3,7 -2,0 10 2 10 2 3 0 2002 1992116 Micronesia, Estados Federados de 23 18 - 28 -3,6 -1,5 -1,6 4 0 5 0 0 0 1994 …117 Mónaco 4 4 - 5 … -2,3 -5,3 5 0 0 0 0 0 1987 …118 Mongolia 68 54 - 81 -3,0 -3,4 -3,4 3 0 10 2 4 0 2003 1998119 Mozambique 158 142 - 175 -2,0 -3,4 -3,9 0 1 0 4 0 0 … 1999120 Myanmar 106 80 - 133 -2,1 -1,2 -0,9 3 1 10 2 2 0 2001 1999121 Namibia 65 54 - 75 -2,2 -2,2 -2,1 0 0 0 1 0 2 … 2001122 Nauru 30 26 - 35 … 0,0 0,0 0 0 3 1 0 0 1995 1992123 Nepal 82 69 - 96 -3,7 -4,6 -4,6 0 3 0 3 0 1 … 2001124 Nicaragua 38 32 - 45 -5,2 -3,7 -3,7 3 1 9 2 3 1 2002 2001125 Níger 262 219 - 303 -1,6 -1,8 -1,0 0 1 0 3 0 1 … 2000126 Nigeria 198 173 - 227 0,3 -2,9 -1,1 0 1 0 4 0 1 … 2003127 Niue 33 14 - 73 … … … 10 0 10 0 1 0 2000 …128 Noruega 4 4 - 5 -10,0 -1,1 -4,5 10 0 10 0 3 0 2002 …129 Nueva Ze<strong>la</strong>ndia 6 5 - 7 -4,8 -1,8 -6,6 10 0 10 0 4 0 2003 …130 Omán 12 11 - 15 -9,7 -4,9 -4,9 0 0 0 2 0 0 … 1995131 Países Bajos 6 5 - 6 -5,5 -1,2 -3,1 10 0 10 0 4 0 2003 …132 Pakistán 103 90 - 115 -1,9 -1,8 -1,7 0 11 0 9 0 2 … 2001133 Pa<strong>la</strong>u 28 22 - 35 -1,8 -1,3 -1,3 5 0 10 0 0 0 1999 …134 Panamá 24 21 - 26 -2,5 -2,8 -2,8 10 1 10 1 3 0 2002 1990135 Papua Nueva Guinea 93 76 - 110 -0,6 -0,6 -0,6 1 1 0 2 0 0 1980 1996136 Paraguay 29 23 - 35 -1,7 -1,8 -1,8 10 1 9 2 2 0 2002 1992137 Perú 34 31 - 37 -5,6 -6,9 -6,9 10 3 9 3 1 1 2000 2000138 Polonia 8 7 - 9 -4,0 -8,8 -5,1 10 0 10 0 3 0 2002 …139 Portugal 6 5 - 7 -7,9 -5,1 -6,5 10 0 10 0 3 0 2002 …140 Qatar 13 10 - 16 -8,9 0,0 -6,0 8 0 9 1 3 0 2002 1991141 Reino Unido 6 5 - 7 -5,6 -2,2 -2,5 10 0 10 0 3 0 2002 …142 República Árabe Siria 18 16 - 19 -6,8 -6,6 -6,8 5 1 1 3 2 1 2001 2002143 República C<strong>en</strong>troafricana 180 156 - 204 0,0 0,0 0,0 0 1 0 1 0 1 … 2000144 República Checa 5 4 - 5 -6,9 -9,8 -2,2 8 0 10 0 4 0 2003 …145 República de Corea 5 4 - 5 -6,6 -3,4 -3,3 9 2 10 0 4 0 2003 1985146 República Democrática d<strong>el</strong> Congo 205 180 - 229 0,0 0,0 0,0 0 1 0 2 0 1 … 2001147 República Democrática Popu<strong>la</strong>r Lao 91 81 - 99 -3,8 -4,8 -4,8 0 0 0 3 0 0 … 1995148 República de Moldova 32 24 - 40 -0,6 -1,7 -1,0 9 0 10 0 4 1 2003 2000149 República Dominicana 35 29 - 40 -4,0 -5,5 -4,7 10 4 9 3 0 1 1999 2002150 República Popu<strong>la</strong>r Democrática de Corea 55 39 - 72 0,0 0,0 0,0 0 0 0 1 0 0 … 1993Tasa de mortalidad de m<strong>en</strong>ores de 5 años (ambos sexos) aFu<strong>en</strong>te de los datos disponiblesEstado Miembro Por 1000 nacidos vivos Cambio porc<strong>en</strong>tual medio anual 1980–1989 1990–1999 2000–2003 Último año disponible2003 Incertidumbre 1990– 1995– 2000– RC/SRM b Encuesta/ RC/SRM b Encuesta/ RC/SRM b Encuesta/ RC/SRM Encuesta/1994 1999 2003 C<strong>en</strong>so c C<strong>en</strong>so c C<strong>en</strong>so c C<strong>en</strong>so151 República Unida de Tanzanía 165 149 - 180 0,1 0,1 0,0 0 1 0 7 0 1 … 2000152 Rumania 20 19 - 21 -3,3 -2,9 -4,0 10 0 10 0 3 0 2002 …153 Rwanda 203 183 - 222 3,9 -0,6 0,0 0 1 0 3 0 1 … 2000154 Saint Kitts y Nevis 22 19 - 26 -3,6 -3,6 -3,6 10 0 10 0 1 0 2000 …155 Samoa 24 21 - 28 -7,1 -2,1 -2,2 1 0 2 1 2 1 2002 2000156 San Marino 3 3 - 5 -10,2 -11,6 -4,3 10 0 10 0 4 0 2003 …157 Santa Lucía 14 12 - 17 -7,6 0,0 -6,3 10 0 10 0 2 0 2001 …158 Santo Tomé y Príncipe 118 95 - 141 0,0 0,0 0,0 3 0 0 0 0 1 1987 2000159 San Vic<strong>en</strong>te y <strong>la</strong>s Granadinas 22 19 - 26 -2,7 0,7 -0,5 10 0 10 0 0 0 1999 …160 S<strong>en</strong>egal 137 118 - 156 -0,7 -0,6 -0,6 0 1 0 6 0 1 … 2000161 Serbia y Mont<strong>en</strong>egro 14 13 - 15 -5,8 -4,0 -4,0 8 0 10 0 1 0 2000 …162 Seych<strong>el</strong>les 15 12 - 19 -1,0 -3,2 -3,2 10 0 10 0 1 0 2000 …163 Sierra Leona 283 240 - 331 -0,6 -0,5 -0,3 0 1 0 0 0 1 … 2000164 Singapur 3 3 - 3 -10,7 -3,9 -8,3 10 0 10 0 2 0 2001 …165 Somalia 225 181 - 283 0,0 0,0 0,0 0 0 0 0 0 1 … 2000166 Sri Lanka 15 13 - 17 -4,9 -4,7 -8,5 10 1 6 1 0 0 1996 1993167 Sudáfrica 66 58 - 74 -0,3 1,3 1,6 9 0 10 2 0 0 1999 1998168 Sudán 93 81 - 104 -2,5 -1,8 -1,5 0 1 0 3 0 0 … 1999169 Suecia 4 3 - 4 -8,8 -2,8 -0,8 10 0 10 0 4 0 2003 …170 Suiza 5 4 - 6 -6,4 -1,2 -4,3 10 0 10 0 4 0 2003 …171 Suriname 39 35 - 44 -1,7 -1,4 -1,4 9 0 8 0 0 1 1997 2000172 Swazi<strong>la</strong>ndia 153 140 - 166 0,0 5,2 2,5 0 1 0 0 0 1 … 2000173 Tai<strong>la</strong>ndia 26 23 - 29 -3,2 -3,1 -3,1 10 6 10 2 3 1 2002 2000174 Tayikistán 118 100 - 136 -0,8 -0,5 -0,5 7 0 9 0 2 1 2001 2000175 Timor-Leste 125 104 - 146 -2,0 -2,1 -1,6 0 0 0 0 0 1 … 2000176 Togo 140 124 - 155 -0,8 -0,6 -0,6 0 1 0 1 0 0 … 1998177 Tonga 19 16 - 23 -2,7 -2,4 -2,7 0 0 6 0 1 0 2002 …178 Trinidad yTabago 20 17 - 23 -5,6 2,1 0,0 10 1 9 0 0 0 1998 1987179 Túnez 24 21 - 26 -6,6 -5,4 -5,4 4 3 9 1 1 0 2000 1994180 Turkm<strong>en</strong>istán 102 93 - 112 -1,7 2,2 1,0 7 0 9 0 0 1 1998 2000181 Turquía 39 37 - 41 -5,1 -5,6 -4,7 0 5 10 3 1 0 2000 1998182 Tuvalu 51 39 - 62 0,0 -1,1 -1,1 0 0 9 0 1 0 2000 …183 Ucrania 20 18 - 22 1,8 -2,6 -1,0 9 0 10 0 3 0 2002 …184 Uganda 140 113 - 167 -0,5 -1,5 -1,3 0 1 0 3 0 1 … 2000185 Uruguay 15 13 - 17 -2,9 -5,8 -3,0 10 1 10 0 2 0 2001 1985186 Uzbekistán 69 63 - 76 -1,1 -1,1 -1,0 9 0 10 1 2 1 2001 2000187 Vanuatu 38 29 - 46 -4,4 -4,7 -4,7 0 1 0 0 0 0 … 1989188 V<strong>en</strong>ezue<strong>la</strong>, República Bolivariana de 21 19 - 23 -0,8 -2,4 -2,4 10 1 10 1 1 0 2000 1990189 Viet Nam 23 20 - 26 -3,7 -7,4 -8,0 0 2 0 3 0 1 … 2002190 Yem<strong>en</strong> 113 88 - 137 -2,4 -1,5 -1,2 0 0 0 3 0 0 … 1997191 Zambia 182 154 - 210 0,2 0,0 0,0 0 1 1 3 1 1 2000 2002192 Zimbabwe 126 111 - 141 2,4 5,4 2,5 0 4 5 4 0 0 1995 1999aLa tasa de mortalidad de m<strong>en</strong>ores de 5 años es <strong>la</strong> probabilidad (expresada por 1000 nacidos vivos) de que un niño nacido <strong>en</strong> un determinado año mueraantes de alcanzar los cinco años de edad, t<strong>en</strong>i<strong>en</strong>do <strong>en</strong> cu<strong>en</strong>ta <strong>la</strong>s tasas de mortalidad por edad d<strong>el</strong> mom<strong>en</strong>to. Las estimaciones pres<strong>en</strong>tadas aquí coincid<strong>en</strong>con <strong>la</strong>s d<strong>el</strong> cuadro 1 de este anexo. Repecto a <strong>la</strong>s fu<strong>en</strong>tes y los métodos, véanse <strong>la</strong>s notas explicativas.bLa columna «RC/SRM» (registro civil/sistema de registro por muestreo) indica <strong>el</strong> número de años de datos de cualquiera de los sistemas disponibles <strong>en</strong> <strong>la</strong>OMS.cEn <strong>la</strong> columna «Encuesta/C<strong>en</strong>so» se indica <strong>el</strong> número de <strong>en</strong>cuestas y c<strong>en</strong>sos disponibles <strong>en</strong> <strong>la</strong> OMS.... No disponible.
- Page 1 and 2:
panorama generalInforme sobre la sa
- Page 3 and 4:
mensaje deldirector generalpanorama
- Page 5 and 6:
4 Informe sobre la salud en el mund
- Page 7 and 8:
6 Informe sobre la salud en el mund
- Page 9 and 10:
8 Informe sobre la salud en el mund
- Page 11 and 12:
10 Informe sobre la salud en el mun
- Page 13 and 14:
12 Informe sobre la salud en el mun
- Page 15 and 16:
14 Informe sobre la salud en el mun
- Page 17 and 18:
16 Informe sobre la salud en el mun
- Page 19 and 20:
Los niños son el futuro de la soci
- Page 21 and 22:
iiInforme sobre la salud en el mund
- Page 23 and 24:
ivInforme sobre la salud en el mund
- Page 25 and 26:
viInforme sobre la salud en el mund
- Page 27 and 28:
viiiInforme sobre la salud en el mu
- Page 29 and 30:
mensaje deldirector generalpanorama
- Page 31 and 32:
xiv Informe sobre la salud en el mu
- Page 33 and 34:
xvi Informe sobre la salud en el mu
- Page 35 and 36:
xviii Informe sobre la salud en el
- Page 37 and 38:
xx Informe sobre la salud en el mun
- Page 39 and 40:
xxii Informe sobre la salud en el m
- Page 41 and 42:
xxiv Informe sobre la salud en el m
- Page 43 and 44:
xxvi Informe sobre la salud en el m
- Page 45 and 46:
2Informe sobre la salud en el mundo
- Page 47 and 48:
4Informe sobre la salud en el mundo
- Page 49 and 50:
6Informe sobre la salud en el mundo
- Page 51 and 52:
8Informe sobre la salud en el mundo
- Page 53 and 54:
10Informe sobre la salud en el mund
- Page 55 and 56:
12Informe sobre la salud en el mund
- Page 57 and 58:
14Informe sobre la salud en el mund
- Page 59 and 60:
16Informe sobre la salud en el mund
- Page 61 and 62:
18Informe sobre la salud en el mund
- Page 63 and 64:
20Informe sobre la salud en el mund
- Page 65 and 66:
capítulo doslos obstáculos a los
- Page 67 and 68:
los obstáculos a los progresos: ¿
- Page 69 and 70:
los obstáculos a los progresos: ¿
- Page 71 and 72:
los obstáculos a los progresos: ¿
- Page 73 and 74:
los obstáculos a los progresos: ¿
- Page 75 and 76:
los obstáculos a los progresos: ¿
- Page 77 and 78:
los obstáculos a los progresos: ¿
- Page 79 and 80:
los obstáculos a los progresos: ¿
- Page 81 and 82:
los obstáculos a los progresos: ¿
- Page 83 and 84:
los obstáculos a los progresos: ¿
- Page 85 and 86:
44Informe sobre la salud en el mund
- Page 87 and 88:
46Informe sobre la salud en el mund
- Page 89 and 90:
48Informe sobre la salud en el mund
- Page 91 and 92:
50Informe sobre la salud en el mund
- Page 93 and 94:
52Informe sobre la salud en el mund
- Page 95 and 96:
54Informe sobre la salud en el mund
- Page 97 and 98:
56Informe sobre la salud en el mund
- Page 99 and 100:
58Informe sobre la salud en el mund
- Page 101 and 102:
60Informe sobre la salud en el mund
- Page 103 and 104:
62Informe sobre la salud en el mund
- Page 105 and 106:
capítulo cuatroatender 136 millone
- Page 107 and 108:
atender 136 millones de partos anua
- Page 109 and 110:
atender 136 millones de partos anua
- Page 111 and 112:
atender 136 millones de partos anua
- Page 113 and 114:
atender 136 millones de partos anua
- Page 115 and 116:
atender 136 millones de partos anua
- Page 117 and 118:
atender 136 millones de partos anua
- Page 119 and 120:
atender 136 millones de partos anua
- Page 121 and 122:
atender 136 millones de partos anua
- Page 123 and 124:
atender 136 millones de partos anua
- Page 125 and 126:
86 Informe sobre la salud en el mun
- Page 127 and 128:
88 Informe sobre la salud en el mun
- Page 129 and 130:
90 Informe sobre la salud en el mun
- Page 131 and 132:
92 Informe sobre la salud en el mun
- Page 133 and 134:
94 Informe sobre la salud en el mun
- Page 135 and 136:
96 Informe sobre la salud en el mun
- Page 137 and 138:
98 Informe sobre la salud en el mun
- Page 139 and 140:
100 Informe sobre la salud en el mu
- Page 141 and 142:
102 Informe sobre la salud en el mu
- Page 143 and 144:
104 Informe sobre la salud en el mu
- Page 145 and 146:
106 Informe sobre la salud en el mu
- Page 147 and 148:
108 Informe sobre la salud en el mu
- Page 149 and 150:
capítulo seisreplanteamiento de la
- Page 151 and 152:
eplanteamiento de la atención infa
- Page 153 and 154:
eplanteamiento de la atención infa
- Page 155 and 156:
eplanteamiento de la atención infa
- Page 157 and 158:
eplanteamiento de la atención infa
- Page 159 and 160:
eplanteamiento de la atención infa
- Page 161 and 162:
eplanteamiento de la atención infa
- Page 163 and 164:
eplanteamiento de la atención infa
- Page 165 and 166:
eplanteamiento de la atención infa
- Page 167 and 168:
eplanteamiento de la atención infa
- Page 169 and 170:
eplanteamiento de la atención infa
- Page 171 and 172:
eplanteamiento de la atención infa
- Page 173 and 174:
136Informe sobre la salud en el mun
- Page 175 and 176:
138Informe sobre la salud en el mun
- Page 177 and 178:
140Informe sobre la salud en el mun
- Page 179 and 180:
142Informe sobre la salud en el mun
- Page 181 and 182:
144Informe sobre la salud en el mun
- Page 183 and 184:
146Informe sobre la salud en el mun
- Page 185 and 186:
148Informe sobre la salud en el mun
- Page 187 and 188:
150Informe sobre la salud en el mun
- Page 189 and 190: 152Informe sobre la salud en el mun
- Page 191 and 192: 154Informe sobre la salud en el mun
- Page 193 and 194: 156Informe sobre la salud en el mun
- Page 195 and 196: 158Informe sobre la salud en el mun
- Page 197 and 198: 160Informe sobre la salud en el mun
- Page 199 and 200: 240Informe sobre la salud en el mun
- Page 201 and 202: 242Informe sobre la salud en el mun
- Page 203 and 204: 244Informe sobre la salud en el mun
- Page 205 and 206: 246Informe sobre la salud en el mun
- Page 207 and 208: anexo estadísticonotas explicativa
- Page 209 and 210: anexo estadístico notas explicativ
- Page 211 and 212: anexo estadístico notas explicativ
- Page 213 and 214: anexo estadístico notas explicativ
- Page 215 and 216: anexo estadístico notas explicativ
- Page 217 and 218: anexo estadístico notas explicativ
- Page 219 and 220: anexo estadístico notas explicativ
- Page 221 and 222: anexo estadístico notas explicativ
- Page 223 and 224: anexo estadístico notas explicativ
- Page 225 and 226: anexo estadístico notas explicativ
- Page 227 and 228: anexo estadístico notas explicativ
- Page 229 and 230: anexo estadístico notas explicativ
- Page 231 and 232: anexo estadístico notas explicativ
- Page 233 and 234: anexo estadístico notas explicativ
- Page 235 and 236: anexo estadístico notas explicativ
- Page 237 and 238: 194 Informe sobre la salud en el mu
- Page 239: 198 Informe sobre la salud en el mu
- Page 243 and 244: 206 Informe sobre la salud en el mu
- Page 245 and 246: 210 Informe sobre la salud en el mu
- Page 247 and 248: 214 Informe sobre la salud en el mu
- Page 249 and 250: 218 Informe sobre la salud en el mu
- Page 251 and 252: 222 Informe sobre la salud en el mu
- Page 253 and 254: 226 Informe sobre la salud en el mu
- Page 255 and 256: 230 Informe sobre la salud en el mu
- Page 257 and 258: 234 Informe sobre la salud en el mu
- Page 259 and 260: OFICINAS DE LA ORGANIZACIÓN MUNDIA