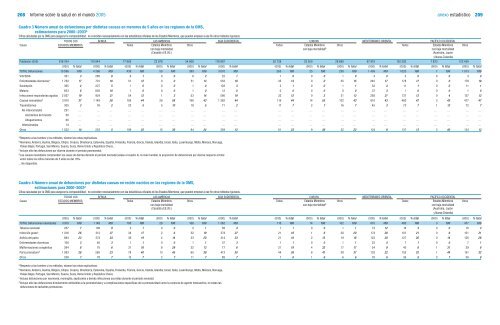
208 <strong>Informe</strong> <strong>sobre</strong> <strong>la</strong> <strong>salud</strong> <strong>en</strong> <strong>el</strong> <strong>mundo</strong> <strong>2005</strong>anexo estadístico 209Cuadro 3 Número anual de defunciones por distintas causas <strong>en</strong> m<strong>en</strong>ores de 5 años <strong>en</strong> <strong>la</strong>s regiones de <strong>la</strong> OMS,estimaciones para 2000–2003 aCifras calcu<strong>la</strong>das por <strong>la</strong> OMS para asegurar <strong>la</strong> comparabilidad; no coincid<strong>en</strong> necesariam<strong>en</strong>te con <strong>la</strong>s estadísticas oficiales de los Estados Miembros, que pued<strong>en</strong> emplear a ese fin otros métodos rigurosos.TODOS LOS ÁFRICA LAS AMÉRICAS ASIA SUDORIENTAL EUROPA MEDITERRÁNEO ORIENTAL PACÍFICO OCCIDENTALCausa ESTADOS MIEMBROS Todos Estados Miembros Otros Todos Estados Miembros Otros Todos Estados Miembros Otroscon baja mortalidad con baja mortalidad b con baja mortalidad(Canadá y EE.UU.)(Australia, Japóny Nueva Ze<strong>la</strong>ndia)Pob<strong>la</strong>ción (000) 616 764 110 944 77 885 22 978 54 908 178 987 50 738 22 050 28 688 67 918 130 292 7 833 122 459(000) % total (000) % total (000) % total (000) % total (000) % total (000) % total (000) % total (000) % total (000) % total (000) % total (000) % total (000) % total (000) % totalTOTAL Defunciones 10 596 100 4 396 100 439 100 50 100 389 100 3 070 100 263 100 25 100 238 100 1 409 100 1 020 100 7 100 1 013 100VIH/SIDA 321 3 285 6 6 1 0 0 6 2 22 1 1 0 0 0 1 0 4 0 3 0 0 0 3 0Enfermedades diarreicas c 1 762 17 701 16 51 12 0 0 51 13 552 18 35 13 0 0 35 15 245 17 178 17 0 0 178 18Sarampión 395 4 227 5 1 0 0 0 1 0 103 3 2 1 0 0 1 1 52 4 11 1 0 0 11 1Ma<strong>la</strong>ria 853 8 802 18 1 0 0 0 1 0 12 0 0 0 0 0 0 37 3 1 0 0 0 1 0Infecciones respiratorias agudas 2 027 19 924 21 54 12 1 2 53 14 590 19 32 12 0 2 31 13 292 21 137 13 0 4 137 13Causas neonatales d 3 910 37 1 148 26 195 44 29 58 166 43 1 362 44 116 44 14 55 102 43 610 43 480 47 3 43 477 47Traumatismos 305 3 76 2 23 5 5 10 18 5 71 2 17 7 2 7 16 7 45 3 73 7 1 12 72 7No int<strong>en</strong>cionados 291 … … … … … … … … … … … … … … … … … … … … … … … … …Accid<strong>en</strong>tes de tránsito 50 … … … … … … … … … … … … … … … … … … … … … … … … …Ahogami<strong>en</strong>tos 60 … … … … … … … … … … … … … … … … … … … … … … … … …Int<strong>en</strong>cionados 14 … … … … … … … … … … … … … … … … … … … … … … … … …Otros 1 022 10 233 5 109 25 15 30 94 24 359 12 61 23 9 36 52 22 124 9 137 13 3 40 134 13aRespecto a <strong>la</strong>s fu<strong>en</strong>tes y los métodos, véanse <strong>la</strong>s notas explicativas.bAlemania, Andorra, Austria, Bélgica, Chipre, Croacia, Dinamarca, Eslov<strong>en</strong>ia, España, Fin<strong>la</strong>ndia, Francia, Grecia, Ir<strong>la</strong>nda, Is<strong>la</strong>ndia, Isra<strong>el</strong>, Italia, Luxemburgo, Malta, Mónaco, Noruega,Países Bajos, Portugal, San Marino, Suecia, Suiza, Reino Unido y República Checa.cIncluye sólo <strong>la</strong>s defunciones por diarrea durante <strong>el</strong> periodo posneonatal.dLas causas neonatales compr<strong>en</strong>d<strong>en</strong> los casos de diarrea durante <strong>el</strong> periodo neonatal (véase <strong>el</strong> cuadro 4). A niv<strong>el</strong> mundial, <strong>la</strong> proporción de defunciones por diarrea respecto al total<strong>en</strong>tre todos los niños m<strong>en</strong>ores de 5 años es d<strong>el</strong> 18%.... No disponible.Cuadro 4 Número anual de defunciones por distintas causas <strong>en</strong> recién nacidos <strong>en</strong> <strong>la</strong>s regiones de <strong>la</strong> OMS,estimaciones para 2000–2003 aCifras calcu<strong>la</strong>das por <strong>la</strong> OMS para asegurar <strong>la</strong> comparabilidad; no coincid<strong>en</strong> necesariam<strong>en</strong>te con <strong>la</strong>s estadísticas oficiales de los Estados Miembros, que pued<strong>en</strong> emplear a ese fin otros métodos rigurosos.TODOS LOS ÁFRICA LAS AMÉRICAS ASIA SUDORIENTAL EUROPA MEDITERRÁNEO ORIENTAL PACÍFICO OCCIDENTALCausa ESTADOS MIEMBROS Todos Estados Miembros Otros Todos Estados Miembros Otros Todos Estados Miembros Otroscon baja mortalidad con baja mortalidad b con baja mortalidad(Canadá y EE.UU.)(Australia, Japóny Nueva Ze<strong>la</strong>ndia)(000) % total (000) % total (000) % total (000) % total (000) % total (000) % total (000) % total (000) % total (000) % total (000) % total (000) % total (000) % total (000) % totalTOTAL Defunciones neonatales 3 910 100 1 148 100 195 100 29 100 166 100 1 362 100 116 100 14 100 102 100 610 100 480 100 3 100 477 100Tétanos neonatal 257 7 108 9 2 1 0 0 2 1 58 4 1 1 0 0 1 1 72 12 16 3 0 0 16 3Infección grave c 1 016 26 313 27 34 17 2 6 32 19 374 27 21 18 1 6 20 20 174 28 101 21 0 6 101 21Asfixia d<strong>el</strong> parto 894 23 274 24 36 19 4 14 33 20 314 23 21 18 2 15 19 18 122 20 127 26 0 14 126 26Enfermedades diarreicas 108 3 40 3 1 1 0 0 1 1 37 3 1 1 0 0 1 1 22 4 7 1 0 0 7 1Malformaciones congénitas 294 8 70 6 31 16 8 29 22 13 77 6 21 19 4 32 17 17 54 9 40 8 1 31 39 8Parto prematuro d 1 083 28 265 23 78 40 13 45 65 39 413 30 44 38 6 41 38 37 132 22 152 32 1 44 151 32Otros 258 7 78 7 13 7 2 7 11 7 89 7 7 6 1 6 6 6 35 6 36 8 0 7 36 8aRespecto a <strong>la</strong>s fu<strong>en</strong>tes y los métodos, véanse <strong>la</strong>s notas explicativas.bAlemania, Andorra, Austria, Bélgica, Chipre, Croacia, Dinamarca, Eslov<strong>en</strong>ia, España, Fin<strong>la</strong>ndia, Francia, Grecia, Ir<strong>la</strong>nda, Is<strong>la</strong>ndia, Isra<strong>el</strong>, Italia, Luxemburgo, Malta, Mónaco, Noruega,Países Bajos, Portugal, San Marino, Suecia, Suiza, Reino Unido y República Checa.cIncluye defunciones por neumonía, m<strong>en</strong>ingitis, septicemia y demás infecciones ocurridas durante <strong>el</strong> periodo neonatal.dIncluye sólo <strong>la</strong>s defunciones directam<strong>en</strong>te atribuibles a <strong>la</strong> prematuridad y a complicaciones específicas de <strong>la</strong> prematuridad como <strong>la</strong> car<strong>en</strong>cia de ag<strong>en</strong>te t<strong>en</strong>sioactivo, no todas <strong>la</strong>sdefunciones de <strong>la</strong>ctantes prematuros.
210 <strong>Informe</strong> <strong>sobre</strong> <strong>la</strong> <strong>salud</strong> <strong>en</strong> <strong>el</strong> <strong>mundo</strong> <strong>2005</strong>anexo estadístico 211Cuadro 5 Algunos indicadores de <strong>la</strong>s cu<strong>en</strong>tas nacionales de <strong>salud</strong>: mediciones d<strong>el</strong> gasto sanitario, 1998–2002Cifras calcu<strong>la</strong>das por <strong>la</strong> OMS para asegurar <strong>la</strong> comparabilidad; a no coincid<strong>en</strong> necesariam<strong>en</strong>te con <strong>la</strong>s estadísticas oficiales de los Estados Miembros,que pued<strong>en</strong> emplear a ese fin otros métodos rigurosos.Gasto sanitario Gasto d<strong>el</strong> gobierno g<strong>en</strong>eral Gasto privado Gasto d<strong>el</strong> gobierno g<strong>en</strong>eraltotal como <strong>en</strong> <strong>salud</strong> como % d<strong>el</strong> <strong>en</strong> <strong>salud</strong> como % d<strong>el</strong> <strong>en</strong> <strong>salud</strong> como % de los gastos% d<strong>el</strong> PIB gasto sanitario total b gasto sanitario total b totales d<strong>el</strong> gobiernoEstado Miembro 1998 1999 2000 2001 2002 1998 1999 2000 2001 2002 1998 1999 2000 2001 2002 1998 1999 2000 2001 20021 Afganistán 6 5,9 6 6,5 8 8,9 7,7 6,3 9 39,2 91,1 92,3 93,7 91 60,8 8,8 9 10,5 14,3 23,12 Albania 6,4 6,5 6,1 6,4 6,1 35,9 37,7 39,2 36 38,7 64,1 62,3 60,8 64 61,3 7 7,3 7,8 7,5 8,13 Alemania 10,6 10,6 10,6 10,8 10,9 78,6 78,6 78,8 78,6 78,5 21,4 21,4 21,2 21,4 21,5 17,1 17,1 18,2 17,5 17,64 Andorra 9,2 6,8 7 6,8 6,5 78,6 71,6 70,1 71 70,5 21,4 28,4 29,9 29 29,5 39,1 29,5 25,7 26,3 26,65 Ango<strong>la</strong> 3,1 3,1 3,3 5,3 5 33 41,4 54 51,8 41,9 67 58,6 46 48,2 58,1 1,8 2,1 3,1 5,4 4,16 Antigua y Barbuda 4,6 4,5 4,6 4,8 4,8 71,7 72,2 72 70,8 68,6 28,3 27,8 28 29,2 31,4 14,5 13,9 14,1 15 14,17 Arabia Saudita 5 4,2 3,9 4,5 4,3 79,3 75,5 74,9 77,6 77,1 20,7 24,5 25,1 22,4 22,9 11,2 11,5 11,3 11,1 11,68 Arg<strong>el</strong>ia 3,8 3,7 3,6 3,9 4,3 65,6 66,4 69,6 74,2 74 34,4 33,6 30,4 25,8 26 8,1 8,4 8,8 9,4 9,19 Arg<strong>en</strong>tina 8,2 9 8,9 9,5 8,9 55,2 56,2 55,1 53,5 50,2 44,8 43,8 44,9 46,5 49,8 14,6 14,8 14,5 14,2 15,310 Arm<strong>en</strong>ia 5,8 7,1 5,2 7 5,8 24,7 30,8 29,8 21,5 22,9 75,3 69,2 70,2 78,5 77,1 5,7 7,6 6,1 6,2 611 Australia 8,7 8,9 9,2 9,3 9,5 68,3 69,8 69,1 68,3 67,9 31,7 30,2 30,9 31,7 32,1 15,7 16,3 16,4 16,7 17,112 Austria 7,7 7,8 7,7 7,6 7,7 69,7 69,6 69,6 68,5 69,9 30,3 30,4 30,4 31,5 30,1 9,9 10,1 10,3 10,2 10,513 Azerbaiyán 4,7 4,6 3,9 3,8 3,7 19,3 21,6 22 23 22,1 80,7 78,4 78 77 77,9 3,8 4,2 4,2 4,3 2,914 Bahamas 7,5 7 7 6,8 6,9 44,9 46,8 47,2 47,5 48,6 55,1 53,2 52,8 52,5 51,4 13,8 14,4 14,3 13,6 14,615 Bahrein 4,9 4,7 4,1 4,3 4,4 70,6 70 69,3 70,4 72 29,4 30 30,8 29,6 28 11,5 11,4 10,8 10,8 9,516 Bang<strong>la</strong>desh 3,1 3,2 3,2 3,2 3,1 30,7 27,2 25,6 25,8 25,2 69,3 72,8 74,4 74,2 74,8 5,4 4,7 4,3 4,7 4,417 Barbados 6 6,1 6,2 6,7 6,9 65,4 65,4 65,8 67,6 68,4 34,6 34,6 34,2 32,4 31,6 11,8 12 12 12,2 12,318 Be<strong>la</strong>rús 6 6,1 6,1 6,6 6,4 82,1 81,1 80,1 75,5 73,9 17,9 18,9 19,9 24,5 26,1 10,9 10,4 10,7 10,7 10,519 Bélgica 8,6 8,7 8,8 9 9,1 70,2 70,6 70,5 71,4 71,2 29,8 29,4 29,5 28,6 28,8 11,9 12,3 12,6 13 12,820 B<strong>el</strong>ice 4,9 5,1 5 5,2 5,2 51,7 48,6 48 45,1 47,3 48,3 51,4 52 54,9 52,7 5,6 5,5 5,3 5 5,321 B<strong>en</strong>in 4,5 4,3 4,6 4,9 4,7 40,9 37 43,4 46,2 44,4 59,1 63 56,6 53,8 55,6 11,2 9 9,8 11,9 11,122 Bhután 3,8 3,5 3,9 3,6 4,5 90,3 89,6 90,6 91,2 92,2 9,7 10,4 9,4 8,8 7,8 9,2 8,3 9,3 7,8 1223 Bolivia 5 6,2 6,1 6,4 7 62,9 58,1 60,1 59,3 59,8 37,1 41,9 39,9 40,7 40,2 10,2 10,5 9,9 10,4 11,624 Bosnia y Herzegovina 6,5 10,7 9,7 9,2 9,2 27,3 56,7 52 48,8 49,8 72,7 43,3 48 51,2 50,2 2,9 8,9 7,8 7,9 8,825 Botswana 4,8 5,1 5,1 5,4 6 53,3 54,1 54,3 56,7 61,9 46,7 45,9 45,7 43,3 38,1 5,6 5,6 5,9 6,3 7,526 Brasil 7,4 7,8 7,6 7,8 7,9 44 42,8 41 42,9 45,9 56 57,2 59 57,1 54,1 9 9,3 8,5 9,2 10,127 Brunei Darussa<strong>la</strong>m 3,8 3,5 3,6 3,5 3,5 81,3 79,4 80 78,3 78,2 18,7 20,6 20 21,7 21,8 5,1 4,8 5,1 4,6 4,728 Bulgaria 5,1 6,2 6,5 7,1 7,4 67,9 66,5 61,2 55,8 53,4 32,1 33,5 38,8 44,2 46,6 9,1 10,3 9,3 9,5 10,129 Burkina Faso 4,3 4,6 4,5 4,1 4,3 38,7 42 40 39,7 45,9 61,3 58 60 60,3 54,1 8,7 8,2 7,8 8,7 10,630 Burundi 3,1 3 3,1 3,2 3 20,5 19,9 17,9 20,8 21,5 79,5 80,1 82,1 79,2 78,5 2,4 2,1 2 2,2 231 Cabo Verde 5,1 4,5 4,6 5 5 75,3 73,9 73,5 75,8 75,1 24,7 26,1 26,5 24,2 24,9 10,2 9 9,6 12,4 11,132 Camboya 10,5 10,8 11,8 11,8 12 10,1 10,1 14,2 14,9 17,1 89,9 89,9 85,8 85,1 82,9 11,8 11,3 15,7 16 18,633 Camerún 4,4 4,9 4,7 4,5 4,6 17 24,4 27,8 26,2 26,2 83 75,6 72,2 73,8 73,8 4,6 7,2 9,5 7,4 7,934 Canadá 9,2 9 8,9 9,4 9,6 70,6 70,3 70,4 70,1 69,9 29,4 29,7 29,6 29,9 30,1 14,3 14,7 15,2 15,8 15,935 Chad 5,4 6,2 6,9 6,6 6,5 31,4 33,2 41,2 41,5 41,9 68,6 66,8 58,8 58,5 58,1 11,2 10,5 12,9 13,6 12,236 Chile 6,1 6 5,7 5,7 5,8 36,4 38,4 42,2 43,7 45,1 63,6 61,6 57,8 56,3 54,9 8,3 8,3 9 9,7 10,237 China 4,8 5,1 5,6 5,7 5,8 39 38 34,6 35,5 33,7 61 62 65,4 64,5 66,3 13,3 11,8 10,3 10 1038 Chipre 6,1 6,2 6,3 6,6 7 39,5 38,7 37,6 38,4 41,3 60,5 61,3 62,4 61,6 58,7 6,2 6,2 6,1 6,3 6,839 Colombia 9,9 9,7 8 8,3 8,1 67,5 73,2 77,9 80,7 82,9 32,5 26,8 22,1 19,3 17,1 24,9 23,2 21,4 20,1 20,440 Comoras 3,4 3,2 2,7 2,3 2,9 63,4 60,8 54,9 46,9 58 36,6 39,2 45,1 53,1 42 8,8 11,2 9,6 6 8,241 Congo 3,3 2,7 2,1 2,1 2,2 72,4 68,4 70,2 69 70,3 27,6 31,6 29,8 31 29,7 5,6 5,7 5,6 5,7 642 Costa Rica 8,1 7,9 8,3 8,8 9,3 69,3 68,1 66,7 65,2 65,4 30,7 31,9 33,3 34,8 34,6 24,1 24,6 24,2 23,3 24,443 Côte d’Ivoire 6,4 6,1 6,3 6,2 6,2 24,6 23,2 21,3 20,1 22,4 75,4 76,8 78,7 79,9 77,6 7,6 7,2 7,5 7,5 7,244 Croacia 7,9 8,6 9 8,2 7,3 85,1 86,1 86,4 85,5 81,4 14,9 13,9 13,6 14,5 18,6 12,9 13,5 14,5 13,8 1245 Cuba 6,6 7,1 7,1 7,3 7,5 84,7 85,5 85,8 86 86,5 15,3 14,5 14,2 14 13,5 10,3 11,1 10,8 11,4 11,346 Dinamarca 8,4 8,5 8,4 8,6 8,8 82 82,2 82,4 82,7 82,9 18 17,8 17,6 17,4 17,1 11,9 12,4 12,6 12,9 13,147 Djibouti 6,3 6,2 6,3 6,1 6,3 52,5 52,9 52,8 51,5 52,9 47,5 47,1 47,2 48,5 47,1 10 10 10,1 10,6 10,148 Dominica 5,8 6,2 5,8 6 6,4 73,3 74,3 71,5 71,3 71,3 26,7 25,7 28,5 28,7 28,7 11,8 12,8 12,8 10,5 12,249 Ecuador 4,4 4,7 4,1 4,8 4,8 38,3 39,4 31,2 33,5 36 61,7 60,6 68,8 66,5 64 9,3 9,8 6,4 8,5 8,850 Egipto 5 4,9 5 5,1 4,9 34,7 35,9 35,3 37,8 36,6 65,3 64,1 64,7 62,2 63,4 6,8 5,9 5,8 6,4 651 El Salvador 8,2 8 8 7,7 8 42,5 43,5 45,1 42,4 44,7 57,5 56,5 54,9 57,6 55,3 24,2 25,1 25 21,2 22,852 Emiratos Árabes Unidos 4 3,5 3,4 3,4 3,1 77 75 75,5 75,1 73,4 23 25 24,5 24,9 26,6 7,7 7,2 7,3 6,9 7,353 Eritrea 4,7 4,2 4,8 5,1 5,1 66,1 59,7 62,7 61,5 63,7 33,9 40,3 37,3 38,5 36,3 4,1 2,7 4,5 5,3 5,654 Eslovaquia 5,7 5,9 5,7 5,7 5,9 91,6 89,9 89,7 89,6 89,4 8,4 10,1 10,3 10,4 10,6 8,6 9,4 8,5 10 10,355 Eslov<strong>en</strong>ia 7,8 7,7 8 8,3 8,3 75,7 75,5 76 74,9 74,9 24,3 24,5 24 25,1 25,1 14,3 14 13,5 14,6 14,7Recursos externos para <strong>la</strong> <strong>salud</strong> Gasto de <strong>la</strong> seguridad social Gasto directo de los hogares P<strong>la</strong>nes de prepagocomo % d<strong>el</strong> <strong>en</strong> <strong>salud</strong> como % d<strong>el</strong> gasto como % d<strong>el</strong> gasto como % d<strong>el</strong> gastogasto total <strong>en</strong> <strong>salud</strong> d<strong>el</strong> gobierno g<strong>en</strong>eral <strong>en</strong> <strong>salud</strong> privado <strong>en</strong> <strong>salud</strong> privado <strong>en</strong> <strong>salud</strong>Estado Miembro 1998 1999 2000 2001 2002 1998 1999 2000 2001 2002 1998 1999 2000 2001 2002 1998 1999 2000 2001 20021 Afganistán 1,7 1,9 2,4 5,3 42,6 0 0 0 0 0 99 99 99 99 80 0 0 0 0 02 Albania 5,8 6,9 8,7 4,9 3,8 24,8 23,4 20,1 20 22,5 99,7 99,8 99,7 99,8 99,7 0 0 0 0 03 Alemania 0 0 0 0 0 87 87,2 87,3 87,1 87,4 52,4 50,8 49,7 49,6 48,2 37,3 38,2 39,2 39,2 39,94 Andorra 0 0 0 0 0 60 87,5 88,1 86,2 84,9 95,2 95,6 96,1 92,6 96,6 nd nd nd nd nd5 Ango<strong>la</strong> 6,2 9,2 14,9 11,8 7,9 0 0 0 0 0 100 100 100 100 100 0 0 0 0 06 Antigua y Barbuda 3,9 3,8 3,8 3,4 1,1 0 0 0 0 0 100 100 100 100 100 nd nd nd nd nd7 Arabia Saudita 0 0 0 0 0 0 0 0 0 0 34 32,5 30,1 30,4 30,1 38 39 40,5 39,9 40,18 Arg<strong>el</strong>ia 0 0,1 0,1 0,1 0,1 46,1 44,1 36,2 33,8 51,1 84 83,4 80,2 80 76,6 2,6 2,7 2,6 3,2 4,69 Arg<strong>en</strong>tina 0,3 0,3 0,3 0,3 0,3 60,3 59,2 59,9 58,4 56,7 63,8 64 63,3 62,4 62,4 32 31,9 32,6 31,1 31,110 Arm<strong>en</strong>ia 11,7 19,6 20,9 24,8 18,6 0 0 0 0 0 89,5 78 79,5 75,1 83,5 nd nd nd nd nd11 Australia 0 0 0 0 0 0 0 0 0 0 56,2 58 61,1 60,9 61,4 23,7 21,6 21,8 23,8 22,712 Austria 0 0 0 0 0 56,6 57,3 58 59,2 58,9 59 60 61,3 58 58 25,2 24,2 23,9 23,6 24,613 Azerbaiyán 0,8 1,1 2,2 4,2 4 0 0 0 0 0 100 100 100 100 100 0 nd nd nd nd14 Bahamas nd nd nd 0,2 nd 2,2 1,8 1,8 2,3 2,1 40,3 40,3 40,3 40,3 40,3 58,6 58,6 58,6 58,6 58,615 Bahrein 0 0 0 0 0 0,3 0,3 0,4 0,4 0,4 74,1 73,5 70,2 70,4 69,2 22,6 23,2 26 25,9 26,916 Bang<strong>la</strong>desh 12,3 12,2 12,9 13,3 13,5 0 0 0 0 0 93 88,8 86,5 86 85,9 0 0 0 0 0,117 Barbados 4,5 4,2 4 4,4 4,2 0 0 0 0 0 76,5 77,2 77,3 76,9 77,2 23,5 22,8 22,7 23,1 22,818 Be<strong>la</strong>rús 0 0,1 0,1 0,2 0,1 6,6 7,6 8,1 7,4 7,7 74 70,6 70,4 74,7 79,7 nd nd 0,3 0,1 0,219 Bélgica 0 0 0 0 0 89,3 86,6 82,2 77,7 77,7 84,4 83,9 84,2 86,8 86,3 6,8 6,8 6,5 6,7 6,720 B<strong>el</strong>ice 3,6 3,1 2,9 8,5 8 0 0 0 12,5 21,6 100 100 100 100 100 0 0 0 0 021 B<strong>en</strong>in 25,9 14,4 23,4 61,8 65,9 nd nd nd nd nd 91,1 91 91 90,6 90,3 8,3 8,4 8,4 8,7 922 Bhután 17,9 36,8 17,1 18,5 18,7 0 0 0 0 0 100 100 100 100 100 0 0 0 0 023 Bolivia 6,2 5,7 6 7,1 7 63,3 60,9 62 65,2 65 74,2 83,8 81,6 77,9 81,3 10,9 5,5 8,1 12 9,524 Bosnia y Herzegovina 9,5 3,9 5,2 3 1,8 78 79 78 79 80 100 100 100 100 100 0 0 0 0 025 Botswana 2,4 2,2 1,9 2,5 3,8 nd nd nd nd nd 28,8 30,3 31,3 31,9 30,8 23,8 22,7 20,6 20,2 19,926 Brasil 0,3 0,5 0,5 0,5 0,5 0 0 0 0 0 66,9 67,1 64,9 64,1 64,2 33,1 32,9 35,1 35,9 35,827 Brunei Darussa<strong>la</strong>m nd nd nd nd nd 0 0 0 0 0 100 100 100 100 100 0 0 0 0 028 Bulgaria 0,1 0,5 1,9 1,5 1,4 0 9,4 11,8 36,2 34,1 98,6 99 99 99,2 98,4 0 0 0 0,1 0,929 Burkina Faso 13,2 13,2 11,8 6,6 5,8 0,8 0,4 0,9 1,4 0,9 99 99 99 98,9 98,9 nd nd nd nd nd30 Burundi 18,6 18 14,5 15,8 16,2 nd nd nd nd nd 100 100 100 100 100 nd nd nd nd nd31 Cabo Verde 7,6 8,4 13,5 15,1 19,3 30,2 36,9 36,1 35,1 33,6 99,9 99,7 99,6 99,5 99,8 0,1 0,3 0,4 0,5 0,232 Camboya 12,4 13,4 18,8 19,7 4,9 0 0 0 0 0 89,6 90,1 85,4 84,6 85,2 0 0 0 0 033 Camerún 5,9 5,2 6,1 7 6,4 0,1 0,1 0,1 0,1 0,1 94,1 94,2 93,7 93,6 93,7 nd nd nd nd nd34 Canadá 0 0 0 0 0 1,8 1,9 2 2 2,1 55,2 55,1 53,7 51 50,3 38,1 37,9 38,9 41,4 42,135 Chad 23,3 22,3 28,4 22,8 27,9 nd nd nd nd nd 96,4 96,7 96,6 96,5 96,5 0,4 0,3 0,4 0,4 0,436 Chile 0,1 0,1 0,1 0,1 0 93,6 92,8 36,8 37,7 37,1 71,4 71 47,1 48 48,7 28,6 28,9 52,9 52 51,337 China 0,2 0,3 0,2 0,1 0,1 53 51,4 50,7 50,7 50,8 94 94,9 95,6 95,7 96,3 0,6 0,4 0,4 0,4 0,438 Chipre 0 0 0 2,6 2,3 0 0 0 0,1 0 98,7 98,4 97,8 97,9 97,9 1,3 1,6 2,2 2,1 2,139 Colombia 0,3 0,3 0,3 0,1 0 62,3 63,2 60,2 61 59,3 84 76,5 66,1 61,1 57 10,7 15,3 22,8 26,2 31,440 Comoras 50,8 47,6 35,9 25,7 43 0 0 0 0 0 100 100 100 100 100 0 0 0 0 041 Congo 3,4 2,5 2,1 2,3 2,2 0 0 0 0 0 100 100 100 100 100 nd nd nd nd nd42 Costa Rica 0,8 0,7 0,8 1,5 1,3 78,7 79,8 80,7 82,2 82,9 98,4 98,7 98,8 98,9 99 1,6 1,3 1,2 1,1 143 Côte d’Ivoire 3,1 3,3 3,4 2,7 2,2 22,3 23,7 22,6 22,6 23,5 94,5 94,5 94,7 94,7 94,6 5,5 5,5 5,3 5,3 5,444 Croacia 0,5 1 1 1,1 1,1 97,6 97,4 97,6 97,7 97,7 100 100 100 100 100 0 0 0 0 045 Cuba 0,1 0,2 0,2 0,3 0,2 0 0 0 0 0 78,5 76 75,6 75,2 75,2 0 0 0 0 046 Dinamarca 0 0 0 0 0 0 0 0 0 0 92 90,4 90,3 90,8 89,8 8 9,6 9 9,2 9,447 Djibouti 10,2 10,5 11,8 15,5 20,3 0 0 0 0 0 54,5 53,6 53,4 53,3 52,9 nd nd nd nd nd48 Dominica 2,3 2,1 1,3 0,9 0,5 0 0 0 0 0 100 100 100 100 100 nd nd nd nd nd49 Ecuador 2,4 3,2 4,1 1,8 0,9 15,4 31,7 28 32,2 35,4 79,1 84,2 85,3 87,6 88,4 6,4 5,4 4,8 3 2,350 Egipto 1,4 1,6 1,9 1,9 1,6 20,9 20,3 20 19,9 22 92,5 92,3 92,3 92,3 92 0,6 0,6 0,6 0,6 0,651 El Salvador 2,9 1,5 0,9 0,8 0,7 41,7 44 44,2 36,3 44,5 94 90,2 95,6 93,6 93,9 5,8 9,6 4,2 6,4 6,152 Emiratos Árabes Unidos 0 0 0 0 0 0 0 0 0 0 69,5 67,2 65,2 65,6 65,2 16,9 18,5 19,5 19,1 19,153 Eritrea 41,5 47,9 47,9 39,1 49,2 0 0 0 0 0 100 100 100 100 100 0 0 0 0 054 Eslovaquia 0,1 0,1 0 0 0 96,6 91,2 91,3 91,9 92,7 100 100 100 100 100 0 0 0 0 055 Eslov<strong>en</strong>ia 0 0 0,1 0,1 0,1 87,9 87,5 87,5 87,2 87,1 44,4 39,3 38,6 41,7 40,9 55,6 60,7 61,4 58,3 58,3
- Page 1 and 2:
panorama generalInforme sobre la sa
- Page 3 and 4:
mensaje deldirector generalpanorama
- Page 5 and 6:
4 Informe sobre la salud en el mund
- Page 7 and 8:
6 Informe sobre la salud en el mund
- Page 9 and 10:
8 Informe sobre la salud en el mund
- Page 11 and 12:
10 Informe sobre la salud en el mun
- Page 13 and 14:
12 Informe sobre la salud en el mun
- Page 15 and 16:
14 Informe sobre la salud en el mun
- Page 17 and 18:
16 Informe sobre la salud en el mun
- Page 19 and 20:
Los niños son el futuro de la soci
- Page 21 and 22:
iiInforme sobre la salud en el mund
- Page 23 and 24:
ivInforme sobre la salud en el mund
- Page 25 and 26:
viInforme sobre la salud en el mund
- Page 27 and 28:
viiiInforme sobre la salud en el mu
- Page 29 and 30:
mensaje deldirector generalpanorama
- Page 31 and 32:
xiv Informe sobre la salud en el mu
- Page 33 and 34:
xvi Informe sobre la salud en el mu
- Page 35 and 36:
xviii Informe sobre la salud en el
- Page 37 and 38:
xx Informe sobre la salud en el mun
- Page 39 and 40:
xxii Informe sobre la salud en el m
- Page 41 and 42:
xxiv Informe sobre la salud en el m
- Page 43 and 44:
xxvi Informe sobre la salud en el m
- Page 45 and 46:
2Informe sobre la salud en el mundo
- Page 47 and 48:
4Informe sobre la salud en el mundo
- Page 49 and 50:
6Informe sobre la salud en el mundo
- Page 51 and 52:
8Informe sobre la salud en el mundo
- Page 53 and 54:
10Informe sobre la salud en el mund
- Page 55 and 56:
12Informe sobre la salud en el mund
- Page 57 and 58:
14Informe sobre la salud en el mund
- Page 59 and 60:
16Informe sobre la salud en el mund
- Page 61 and 62:
18Informe sobre la salud en el mund
- Page 63 and 64:
20Informe sobre la salud en el mund
- Page 65 and 66:
capítulo doslos obstáculos a los
- Page 67 and 68:
los obstáculos a los progresos: ¿
- Page 69 and 70:
los obstáculos a los progresos: ¿
- Page 71 and 72:
los obstáculos a los progresos: ¿
- Page 73 and 74:
los obstáculos a los progresos: ¿
- Page 75 and 76:
los obstáculos a los progresos: ¿
- Page 77 and 78:
los obstáculos a los progresos: ¿
- Page 79 and 80:
los obstáculos a los progresos: ¿
- Page 81 and 82:
los obstáculos a los progresos: ¿
- Page 83 and 84:
los obstáculos a los progresos: ¿
- Page 85 and 86:
44Informe sobre la salud en el mund
- Page 87 and 88:
46Informe sobre la salud en el mund
- Page 89 and 90:
48Informe sobre la salud en el mund
- Page 91 and 92:
50Informe sobre la salud en el mund
- Page 93 and 94:
52Informe sobre la salud en el mund
- Page 95 and 96:
54Informe sobre la salud en el mund
- Page 97 and 98:
56Informe sobre la salud en el mund
- Page 99 and 100:
58Informe sobre la salud en el mund
- Page 101 and 102:
60Informe sobre la salud en el mund
- Page 103 and 104:
62Informe sobre la salud en el mund
- Page 105 and 106:
capítulo cuatroatender 136 millone
- Page 107 and 108:
atender 136 millones de partos anua
- Page 109 and 110:
atender 136 millones de partos anua
- Page 111 and 112:
atender 136 millones de partos anua
- Page 113 and 114:
atender 136 millones de partos anua
- Page 115 and 116:
atender 136 millones de partos anua
- Page 117 and 118:
atender 136 millones de partos anua
- Page 119 and 120:
atender 136 millones de partos anua
- Page 121 and 122:
atender 136 millones de partos anua
- Page 123 and 124:
atender 136 millones de partos anua
- Page 125 and 126:
86 Informe sobre la salud en el mun
- Page 127 and 128:
88 Informe sobre la salud en el mun
- Page 129 and 130:
90 Informe sobre la salud en el mun
- Page 131 and 132:
92 Informe sobre la salud en el mun
- Page 133 and 134:
94 Informe sobre la salud en el mun
- Page 135 and 136:
96 Informe sobre la salud en el mun
- Page 137 and 138:
98 Informe sobre la salud en el mun
- Page 139 and 140:
100 Informe sobre la salud en el mu
- Page 141 and 142:
102 Informe sobre la salud en el mu
- Page 143 and 144:
104 Informe sobre la salud en el mu
- Page 145 and 146:
106 Informe sobre la salud en el mu
- Page 147 and 148:
108 Informe sobre la salud en el mu
- Page 149 and 150:
capítulo seisreplanteamiento de la
- Page 151 and 152:
eplanteamiento de la atención infa
- Page 153 and 154:
eplanteamiento de la atención infa
- Page 155 and 156:
eplanteamiento de la atención infa
- Page 157 and 158:
eplanteamiento de la atención infa
- Page 159 and 160:
eplanteamiento de la atención infa
- Page 161 and 162:
eplanteamiento de la atención infa
- Page 163 and 164:
eplanteamiento de la atención infa
- Page 165 and 166:
eplanteamiento de la atención infa
- Page 167 and 168:
eplanteamiento de la atención infa
- Page 169 and 170:
eplanteamiento de la atención infa
- Page 171 and 172:
eplanteamiento de la atención infa
- Page 173 and 174:
136Informe sobre la salud en el mun
- Page 175 and 176:
138Informe sobre la salud en el mun
- Page 177 and 178:
140Informe sobre la salud en el mun
- Page 179 and 180:
142Informe sobre la salud en el mun
- Page 181 and 182:
144Informe sobre la salud en el mun
- Page 183 and 184:
146Informe sobre la salud en el mun
- Page 185 and 186:
148Informe sobre la salud en el mun
- Page 187 and 188:
150Informe sobre la salud en el mun
- Page 189 and 190:
152Informe sobre la salud en el mun
- Page 191 and 192:
154Informe sobre la salud en el mun
- Page 193 and 194: 156Informe sobre la salud en el mun
- Page 195 and 196: 158Informe sobre la salud en el mun
- Page 197 and 198: 160Informe sobre la salud en el mun
- Page 199 and 200: 240Informe sobre la salud en el mun
- Page 201 and 202: 242Informe sobre la salud en el mun
- Page 203 and 204: 244Informe sobre la salud en el mun
- Page 205 and 206: 246Informe sobre la salud en el mun
- Page 207 and 208: anexo estadísticonotas explicativa
- Page 209 and 210: anexo estadístico notas explicativ
- Page 211 and 212: anexo estadístico notas explicativ
- Page 213 and 214: anexo estadístico notas explicativ
- Page 215 and 216: anexo estadístico notas explicativ
- Page 217 and 218: anexo estadístico notas explicativ
- Page 219 and 220: anexo estadístico notas explicativ
- Page 221 and 222: anexo estadístico notas explicativ
- Page 223 and 224: anexo estadístico notas explicativ
- Page 225 and 226: anexo estadístico notas explicativ
- Page 227 and 228: anexo estadístico notas explicativ
- Page 229 and 230: anexo estadístico notas explicativ
- Page 231 and 232: anexo estadístico notas explicativ
- Page 233 and 234: anexo estadístico notas explicativ
- Page 235 and 236: anexo estadístico notas explicativ
- Page 237 and 238: 194 Informe sobre la salud en el mu
- Page 239 and 240: 198 Informe sobre la salud en el mu
- Page 241 and 242: 202 Informe sobre la salud en el mu
- Page 243: 206 Informe sobre la salud en el mu
- Page 247 and 248: 214 Informe sobre la salud en el mu
- Page 249 and 250: 218 Informe sobre la salud en el mu
- Page 251 and 252: 222 Informe sobre la salud en el mu
- Page 253 and 254: 226 Informe sobre la salud en el mu
- Page 255 and 256: 230 Informe sobre la salud en el mu
- Page 257 and 258: 234 Informe sobre la salud en el mu
- Page 259 and 260: OFICINAS DE LA ORGANIZACIÓN MUNDIA