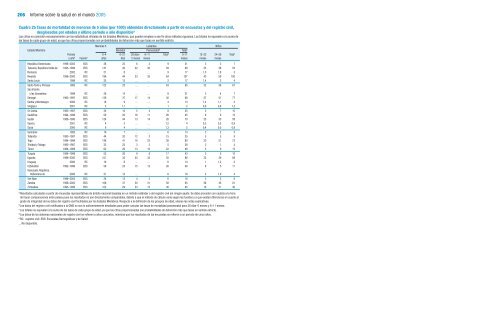
204 <strong>Informe</strong> <strong>sobre</strong> <strong>la</strong> <strong>salud</strong> <strong>en</strong> <strong>el</strong> <strong>mundo</strong> <strong>2005</strong>anexo estadístico 205Cuadro 2b Tasas de mortalidad de m<strong>en</strong>ores de 5 años (por 1000) obt<strong>en</strong>idas directam<strong>en</strong>te a partir de <strong>en</strong>cuestas y d<strong>el</strong> registro civil,desglosadas por edades y último periodo o año disponible aLas cifras no coincid<strong>en</strong> necesariam<strong>en</strong>te con <strong>la</strong>s estadísticas oficiales de los Estados Miembros, que pued<strong>en</strong> emplear a ese fin otros métodos rigurosos. Los totales no equival<strong>en</strong> a <strong>la</strong> suma de<strong>la</strong>s tasas de cada grupo de edad, ya que <strong>la</strong>s cifras proporcionadas son probabilidades de defunción más que tasas <strong>en</strong> s<strong>en</strong>tido estricto.M<strong>en</strong>ores 5 Lactantes NiñosEstado Miembro Neonatal Posneonatal b Total cPeriodo 0–4 0–27 28 días– 6–11 Total c 0–11 12–23 24–59 Total co año d Fu<strong>en</strong>te e años días 5 meses meses meses meses mesesAlbania 2003 RC 14 3 … … 6 8 1,9 4 6Alemania 2001 RC 5 3 … … 1,6 4 0,4 0,6 1Arg<strong>en</strong>tina 2002 RC 19 11 … … 6 17 1,1 1,5 3Arm<strong>en</strong>ia 1996–2000 EDS 39 19 14 3 17 36 0 3 3Australia 2001 RC 6 4 … … 1,6 5 0,4 0,6 1Austria 2003 RC 6 3 … … 1,4 4 0,5 0,7 1,1Bahamas 2000 RC 12 5 … … 4 8 1,5 1,6 3Bahrein 2000 RC 10 4 … … 3 7 0,7 1,9 3Bang<strong>la</strong>desh 1996–2000 EDS 94 42 18 8 24 66 11 19 30Barbados 2000 RC 17 11 … … 5 16 0,9 0,6 1,5Bélgica 1992 RC 10 4 … … 4 8 0,5 0,9 1,4B<strong>el</strong>ice 2000 RC 30 14 … … 9 23 3 2 6B<strong>en</strong>in 1997–2001 EDS 160 38 23 30 51 89 30 50 78Bolivia 1994–1998 EDS 92 34 20 15 33 67 15 11 26Brasil 2000 RC 23 13 … … 8 20 1,7 1,8 3Bulgaria 2003 RC 15 7 … … 5 12 1 1,4 2Burkina Faso 1995–1999 EDS 219 41 36 32 65 105 48 83 127Burundi 1983–1987 EDS 153 35 25 16 38 74 28 59 85Camboya 1996–2000 EDS 124 37 44 17 58 95 11 22 32Camerún 1994–1998 EDS 151 37 20 22 40 77 32 50 80Canadá 2000 RC 6 4 … … 1,7 5 0,3 0,5 0,8Chad 1993–1997 EDS 194 44 30 33 59 103 42 63 1Chile 2002 RC 8 4 … … 3 7 0,6 1 1,6Colombia 1996–2000 EDS 25 15 4 3 7 21 1 2 4Comoras 1992–1996 EDS 104 38 21 20 39 77 13 16 29Costa Rica 2002 RC 12 8 … … 4 11 0,9 1 1,9Côte d’Ivoire 1994–1998 EDS 181 62 28 25 50 112 33 46 77Croacia 2003 RC 7 5 … … 1,5 6 0,3 0,7 1Cuba 2002 RC 8 4 … … 2 7 0,6 1 1,6Dinamarca 1996 RC 7 4 … … 1,6 6 0,6 0,6 1,2Ecuador 2000 RC 26 8 … … 8 16 4 3 7Egipto 1996–2000 EDS 54 24 11 9 20 44 5 6 11El Salvador 1999 RC 15 4 … … 7 11 2 1,7 4Eritrea 1998–2002 EDS 93 24 14 11 24 48 19 29 48Eslovaquia 2002 RC 9 4 … … 3 8 0,7 0,7 1,4Eslov<strong>en</strong>ia 2003 RC 5 3 … … 1 4 0,2 0,6 0,8España 2001 RC 5 3 … … 1,3 4 0,4 0,6 1Estados Unidos de América 2001 RC 8 5 … … 2 7 0,5 0,8 1,3Estonia 2002 RC 8 4 … … 2 6 0,6 1,3 1,9Etiopía 1996–2000 EDS 166 49 28 24 48 97 29 50 77Ex República Yugos<strong>la</strong>vade Macedonia 2000 RC 15 9 … … 3 12 0,9 1 1,9Fiji 1978 RC 39 18 … … 10 28 3 4 7Filipinas 1994–1998 EDS 48 18 9 8 17 35 6 8 14Fin<strong>la</strong>ndia 2003 RC 4 2 … … 1,1 3 0,2 0,6 0,8Francia 2000 RC 5 3 … … 1,6 4 0,4 0,6 1Gabón 1996–2000 EDS 89 30 13 15 27 57 15 19 33Ghana 1994–1998 EDS 108 30 13 15 27 57 20 34 54Grecia 2001 RC 5 4 … … 1,6 5 0,3 0,4 0,7Guatema<strong>la</strong> 1995–1999 EDS 59 23 12 11 22 45 8 6 14Guinea 1995–1999 EDS 177 48 32 21 50 98 35 55 87M<strong>en</strong>ores 5 Lactantes NiñosEstado Miembro Neonatal Posneonatal b Total cPeriodo 0–4 0–27 28 días– 6–11 Total c 0–11 12–23 24–59 Total co año d Fu<strong>en</strong>te e años días 5 meses meses meses meses mesesGuyana 1996 RC 31 14 … … 10 25 4 3 7Haití 1996–2000 EDS 119 32 27 23 48 80 20 22 42Honduras 1981 RC 42 7 … … 16 23 9 9 17Hungría 2003 RC 9 5 … … 3 7 0,5 0,8 1,3India 1995–1999 EDS 95 43 15 11 24 68 12 18 29Indonesia 1993–1997 EDS 58 22 15 10 24 46 5 8 13Ir<strong>la</strong>nda 2001 RC 7 4 … … 1,9 6 0,6 0,9 1,4Is<strong>la</strong>ndia 2001 RC 3 2 … … 0,7 3 0,5 0,2 0,7Isra<strong>el</strong> 2003 RC 6 3 … … 1,8 5 0,5 0,7 1,3Italia 2001 RC 6 3 … … 1,3 5 0,3 0,5 0,8Jamaica 1991 RC 9 3 … … 4 6 1,6 1,2 3Japón 2000 RC 5 1,8 … … 1,5 3 0,5 0,7 1,2Jordania 1998–2002 EDS 27 16 4 3 7 22 2 3 5Kazajstán 1995–1999 EDS 71 34 17 12 28 62 6 4 10K<strong>en</strong>ya 1994–1998 EDS 111 28 25 22 45 74 20 21 41Kirguistán 2003 RC 28 11 … … 10 21 4 3 7Kuwait 2002 RC 13 7 … … 3 10 0,7 1,1 1,8Letonia 2003 RC 13 6 … … 4 9 1,1 1,9 3Liberia 1982–1986 EDS 222 68 48 36 76 144 49 44 91Lituania 2003 RC 9 4 … … 3 7 0,6 1,2 1,8Luxemburgo 2003 RC 5 3 … … 2 5 0,4 0 0,4Madagascar 1993–1997 EDS 159 40 30 29 56 96 32 38 70Ma<strong>la</strong>wi 1996–2000 EDS 189 42 32 34 62 104 42 55 95Malí 1997–2001 EDS 229 57 29 32 56 113 50 85 130Malta 2003 RC 6 5 … … 0,5 6 0,2 0,2 0,5Marruecos 1988–1992 EDS 76 31 17 10 26 57 12 8 20Mauricio 2000 RC 18 12 … … 3 16 1 1,3 2Mauritania 1999–2003 EDS 168 37 30 31 58 95 38 45 81México 2001 RC 20 8 … … 5 13 1,5 1,6 3Mongolia 1994 RC 57 10 … … 25 35 8 10 18Mozambique 1993–1997 EDS 201 54 41 46 81 135 21 57 77Namibia 1996–2000 EDS 62 20 13 6 18 38 8 17 25Nepal 1996–2000 EDS 91 39 16 10 26 64 12 17 29Nicaragua 1997–2001 EDS 39 16 9 6 15 31 5 4 9Níger 1994–1998 EDS 274 44 35 49 79 123 71 109 172Nigeria 1999–2003 EDS 201 48 25 30 52 100 50 65 112Noruega 2002 RC 4 2 … … 1 3 0,5 0,7 1,2Nueva Ze<strong>la</strong>ndia 2000 RC 8 4 … … 3 7 0,5 1 1,6Países Bajos 2003 RC 6 4 … … 1,2 5 0,4 0,6 1Pakistán 1987–1991 EDS 112 49 24 15 37 86 16 13 29Panamá 2002 RC 17 8 … … 6 14 2 2 4Papua Nueva Guinea 1977 RC 12 2 … … 4 6 2 3 5Paraguay 2000 RC 14 6 … … 5 10 1,6 1,5 3Perú 1996–2000 EDS 47 18 9 6 15 33 7 7 14Polonia 2002 RC 9 5 … … 2 8 0,5 0,7 1,2Portugal 2002 RC 7 3 … … 1,6 5 0,6 1 1,6Reino Unido 2002 RC 6 4 … … 1,7 5 0,4 0,5 0,9República C<strong>en</strong>troafricana 1990–1994 EDS 158 42 34 23 55 97 26 42 67República Checa 2003 RC 5 2 … … 1,5 4 0,4 0,6 1República de Moldova 2003 RC 18 7 … … 7 14 1,4 2 3
206 <strong>Informe</strong> <strong>sobre</strong> <strong>la</strong> <strong>salud</strong> <strong>en</strong> <strong>el</strong> <strong>mundo</strong> <strong>2005</strong>anexo estadístico 207Cuadro 2b Tasas de mortalidad de m<strong>en</strong>ores de 5 años (por 1000) obt<strong>en</strong>idas directam<strong>en</strong>te a partir de <strong>en</strong>cuestas y d<strong>el</strong> registro civil,desglosadas por edades y último periodo o año disponible aLas cifras no coincid<strong>en</strong> necesariam<strong>en</strong>te con <strong>la</strong>s estadísticas oficiales de los Estados Miembros, que pued<strong>en</strong> emplear a ese fin otros métodos rigurosos. Los totales no equival<strong>en</strong> a <strong>la</strong> suma de<strong>la</strong>s tasas de cada grupo de edad, ya que <strong>la</strong>s cifras proporcionadas son probabilidades de defunción más que tasas <strong>en</strong> s<strong>en</strong>tido estricto.M<strong>en</strong>ores Under-five 5 Lactantes Infant Niños ChildMember Estado Miembro State Neonatal Post-neonatal Posneonatal b d Total e Periodo Period/ 0–4 0–270 281–5 días– 6–11 Total c 0–11 12–23 24–59 Total co Year año d b Source Fu<strong>en</strong>te e c years años month días months 5 meses months meses months meses months meses months mesesRepública Dominicana 1998–2002 EDS 38 22 6 3 9 31 3 3 7Tanzanía, República Unida de 1995–1999 EDS 147 40 32 30 59 99 25 28 53Rumania 2002 RC 21 8 … … 9 17 1,5 1,8 3Rwanda 1996–2000 EDS 196 44 33 35 64 107 43 59 100Santa Lucía 1999 RC 25 15 … … 2 17 1,4 3 4Santo Tomé y Príncipe 1985 RC 122 23 … … 43 65 32 36 67San Vic<strong>en</strong>tey <strong>la</strong>s Granadinas 1999 RC 26 14 … … 8 21 3 4 7S<strong>en</strong>egal 1993–1997 EDS 139 37 17 14 30 68 27 51 77Serbia y Mont<strong>en</strong>egro 2000 RC 16 9 … … 4 13 1,4 1,1 2Singapur 2001 RC 3 1,1 … … 1 2 0,6 0,6 1,2Sri Lanka 1983–1987 EDS 34 16 5 4 8 25 2 7 10Sudáfrica 1994–1998 EDS 59 20 16 11 26 45 8 6 15Sudán 1986–1990 EDS 124 44 13 14 26 70 25 33 58Suecia 2001 RC 4 3 … … 1,2 4 0,3 0,5 0,8Suiza 2000 RC 6 4 … … 1,3 5 0,4 0,5 0,9Suriname 1992 RC 19 7 … … 6 13 2 2 5Tai<strong>la</strong>ndia 1983–1987 EDS 44 20 12 3 15 35 5 5 9Togo 1994–1998 EDS 146 41 19 22 38 80 23 51 72Trinidad y Tabago 1983–1987 EDS 32 23 3 3 5 28 3 1 4Túnez 1984–1988 EDS 62 26 13 10 22 48 5 9 15Turquía 1994–1998 EDS 52 26 9 8 17 43 5 5 10Uganda 1996–2000 EDS 151 33 25 33 55 88 32 39 69Uruguay 2000 RC 16 8 … … 6 14 1 1,2 2Uzbekistán 1992–1996 EDS 59 23 15 12 26 49 6 5 11V<strong>en</strong>ezue<strong>la</strong>, RepúblicaBolivariana de 2000 RC 21 12 … … 6 18 2 1,9 4Viet Nam 1998–2002 EDS 24 12 4 2 6 18 3 3 6Zambia 1998–2002 EDS 168 37 30 31 58 95 38 45 81Zimbabwe 1995–1999 EDS 102 29 23 15 36 65 19 21 40aResultados calcu<strong>la</strong>dos a partir de <strong>en</strong>cuestas repres<strong>en</strong>tativas de ámbito nacional basadas <strong>en</strong> un método estándar o d<strong>el</strong> registro civil sin ningún ajuste. Se debe proceder con caute<strong>la</strong> a <strong>la</strong> horade hacer comparaciones <strong>en</strong>tre países pues los resultados no son directam<strong>en</strong>te comparables, debido a que <strong>el</strong> método de cálculo varía según <strong>la</strong>s fu<strong>en</strong>tes y a que exist<strong>en</strong> difer<strong>en</strong>cias <strong>en</strong> cuanto algrado de integridad de los datos d<strong>el</strong> registro civil facilitados por los Estados Miembros. Respecto a <strong>la</strong> definición de los groupos de edad, véanse <strong>la</strong>s notas explicativas.bLos datos d<strong>el</strong> registro civil notificados a <strong>la</strong> OMS no son lo sufici<strong>en</strong>tem<strong>en</strong>te detal<strong>la</strong>dos para poder calcu<strong>la</strong>r <strong>la</strong>s tasas de mortalidad posneonatal para 28 días–5 meses y 6–11 meses.cLos totales no equival<strong>en</strong> a <strong>la</strong> suma de <strong>la</strong>s tasas de cada grupo de edad, ya que <strong>la</strong>s cifras proporcionadas son probabilidades de defunción más que tasas <strong>en</strong> s<strong>en</strong>tido estricto.dLos datos de los sistemas nacionales de registro civil se refier<strong>en</strong> a años concretos, mi<strong>en</strong>tras que los resultados de <strong>la</strong>s <strong>en</strong>cuestas se refier<strong>en</strong> a un periodo de cinco años.eRC: registro civil; EDS: Encuestas Demográficas y de Salud.... No disponible.
- Page 1 and 2:
panorama generalInforme sobre la sa
- Page 3 and 4:
mensaje deldirector generalpanorama
- Page 5 and 6:
4 Informe sobre la salud en el mund
- Page 7 and 8:
6 Informe sobre la salud en el mund
- Page 9 and 10:
8 Informe sobre la salud en el mund
- Page 11 and 12:
10 Informe sobre la salud en el mun
- Page 13 and 14:
12 Informe sobre la salud en el mun
- Page 15 and 16:
14 Informe sobre la salud en el mun
- Page 17 and 18:
16 Informe sobre la salud en el mun
- Page 19 and 20:
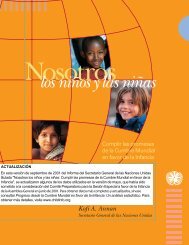
Los niños son el futuro de la soci
- Page 21 and 22:
iiInforme sobre la salud en el mund
- Page 23 and 24:
ivInforme sobre la salud en el mund
- Page 25 and 26:
viInforme sobre la salud en el mund
- Page 27 and 28:
viiiInforme sobre la salud en el mu
- Page 29 and 30:
mensaje deldirector generalpanorama
- Page 31 and 32:
xiv Informe sobre la salud en el mu
- Page 33 and 34:
xvi Informe sobre la salud en el mu
- Page 35 and 36:
xviii Informe sobre la salud en el
- Page 37 and 38:
xx Informe sobre la salud en el mun
- Page 39 and 40:
xxii Informe sobre la salud en el m
- Page 41 and 42:
xxiv Informe sobre la salud en el m
- Page 43 and 44:
xxvi Informe sobre la salud en el m
- Page 45 and 46:
2Informe sobre la salud en el mundo
- Page 47 and 48:
4Informe sobre la salud en el mundo
- Page 49 and 50:
6Informe sobre la salud en el mundo
- Page 51 and 52:
8Informe sobre la salud en el mundo
- Page 53 and 54:
10Informe sobre la salud en el mund
- Page 55 and 56:
12Informe sobre la salud en el mund
- Page 57 and 58:
14Informe sobre la salud en el mund
- Page 59 and 60:
16Informe sobre la salud en el mund
- Page 61 and 62:
18Informe sobre la salud en el mund
- Page 63 and 64:
20Informe sobre la salud en el mund
- Page 65 and 66:
capítulo doslos obstáculos a los
- Page 67 and 68:
los obstáculos a los progresos: ¿
- Page 69 and 70:
los obstáculos a los progresos: ¿
- Page 71 and 72:
los obstáculos a los progresos: ¿
- Page 73 and 74:
los obstáculos a los progresos: ¿
- Page 75 and 76:
los obstáculos a los progresos: ¿
- Page 77 and 78:
los obstáculos a los progresos: ¿
- Page 79 and 80:
los obstáculos a los progresos: ¿
- Page 81 and 82:
los obstáculos a los progresos: ¿
- Page 83 and 84:
los obstáculos a los progresos: ¿
- Page 85 and 86:
44Informe sobre la salud en el mund
- Page 87 and 88:
46Informe sobre la salud en el mund
- Page 89 and 90:
48Informe sobre la salud en el mund
- Page 91 and 92:
50Informe sobre la salud en el mund
- Page 93 and 94:
52Informe sobre la salud en el mund
- Page 95 and 96:
54Informe sobre la salud en el mund
- Page 97 and 98:
56Informe sobre la salud en el mund
- Page 99 and 100:
58Informe sobre la salud en el mund
- Page 101 and 102:
60Informe sobre la salud en el mund
- Page 103 and 104:
62Informe sobre la salud en el mund
- Page 105 and 106:
capítulo cuatroatender 136 millone
- Page 107 and 108:
atender 136 millones de partos anua
- Page 109 and 110:
atender 136 millones de partos anua
- Page 111 and 112:
atender 136 millones de partos anua
- Page 113 and 114:
atender 136 millones de partos anua
- Page 115 and 116:
atender 136 millones de partos anua
- Page 117 and 118:
atender 136 millones de partos anua
- Page 119 and 120:
atender 136 millones de partos anua
- Page 121 and 122:
atender 136 millones de partos anua
- Page 123 and 124:
atender 136 millones de partos anua
- Page 125 and 126:
86 Informe sobre la salud en el mun
- Page 127 and 128:
88 Informe sobre la salud en el mun
- Page 129 and 130:
90 Informe sobre la salud en el mun
- Page 131 and 132:
92 Informe sobre la salud en el mun
- Page 133 and 134:
94 Informe sobre la salud en el mun
- Page 135 and 136:
96 Informe sobre la salud en el mun
- Page 137 and 138:
98 Informe sobre la salud en el mun
- Page 139 and 140:
100 Informe sobre la salud en el mu
- Page 141 and 142:
102 Informe sobre la salud en el mu
- Page 143 and 144:
104 Informe sobre la salud en el mu
- Page 145 and 146:
106 Informe sobre la salud en el mu
- Page 147 and 148:
108 Informe sobre la salud en el mu
- Page 149 and 150:
capítulo seisreplanteamiento de la
- Page 151 and 152:
eplanteamiento de la atención infa
- Page 153 and 154:
eplanteamiento de la atención infa
- Page 155 and 156:
eplanteamiento de la atención infa
- Page 157 and 158:
eplanteamiento de la atención infa
- Page 159 and 160:
eplanteamiento de la atención infa
- Page 161 and 162:
eplanteamiento de la atención infa
- Page 163 and 164:
eplanteamiento de la atención infa
- Page 165 and 166:
eplanteamiento de la atención infa
- Page 167 and 168:
eplanteamiento de la atención infa
- Page 169 and 170:
eplanteamiento de la atención infa
- Page 171 and 172:
eplanteamiento de la atención infa
- Page 173 and 174:
136Informe sobre la salud en el mun
- Page 175 and 176:
138Informe sobre la salud en el mun
- Page 177 and 178:
140Informe sobre la salud en el mun
- Page 179 and 180:
142Informe sobre la salud en el mun
- Page 181 and 182:
144Informe sobre la salud en el mun
- Page 183 and 184:
146Informe sobre la salud en el mun
- Page 185 and 186:
148Informe sobre la salud en el mun
- Page 187 and 188:
150Informe sobre la salud en el mun
- Page 189 and 190:
152Informe sobre la salud en el mun
- Page 191 and 192: 154Informe sobre la salud en el mun
- Page 193 and 194: 156Informe sobre la salud en el mun
- Page 195 and 196: 158Informe sobre la salud en el mun
- Page 197 and 198: 160Informe sobre la salud en el mun
- Page 199 and 200: 240Informe sobre la salud en el mun
- Page 201 and 202: 242Informe sobre la salud en el mun
- Page 203 and 204: 244Informe sobre la salud en el mun
- Page 205 and 206: 246Informe sobre la salud en el mun
- Page 207 and 208: anexo estadísticonotas explicativa
- Page 209 and 210: anexo estadístico notas explicativ
- Page 211 and 212: anexo estadístico notas explicativ
- Page 213 and 214: anexo estadístico notas explicativ
- Page 215 and 216: anexo estadístico notas explicativ
- Page 217 and 218: anexo estadístico notas explicativ
- Page 219 and 220: anexo estadístico notas explicativ
- Page 221 and 222: anexo estadístico notas explicativ
- Page 223 and 224: anexo estadístico notas explicativ
- Page 225 and 226: anexo estadístico notas explicativ
- Page 227 and 228: anexo estadístico notas explicativ
- Page 229 and 230: anexo estadístico notas explicativ
- Page 231 and 232: anexo estadístico notas explicativ
- Page 233 and 234: anexo estadístico notas explicativ
- Page 235 and 236: anexo estadístico notas explicativ
- Page 237 and 238: 194 Informe sobre la salud en el mu
- Page 239 and 240: 198 Informe sobre la salud en el mu
- Page 241: 202 Informe sobre la salud en el mu
- Page 245 and 246: 210 Informe sobre la salud en el mu
- Page 247 and 248: 214 Informe sobre la salud en el mu
- Page 249 and 250: 218 Informe sobre la salud en el mu
- Page 251 and 252: 222 Informe sobre la salud en el mu
- Page 253 and 254: 226 Informe sobre la salud en el mu
- Page 255 and 256: 230 Informe sobre la salud en el mu
- Page 257 and 258: 234 Informe sobre la salud en el mu
- Page 259 and 260: OFICINAS DE LA ORGANIZACIÓN MUNDIA