- Page 1 and 2:
PIANO DI SVILUPPO RURALE PERL’UMB
- Page 3 and 4:
Allegato 1S. GiustinoCiternaCittà
- Page 5 and 6:
INDICEDESCRIZIONE QUANTIFICATA DELL
- Page 7 and 8:
MONITORAGGIO E VALUTAZIONE---------
- Page 9 and 10:
DESCRIZIONE QUANTIFICATA DELLA SITU
- Page 11 and 12:
capacità d’uso del suolo, ovvero
- Page 13 and 14:
miglioramento del suolo che nei sop
- Page 15 and 16:
(numero totale di incendi, superfic
- Page 17 and 18:
2) densità demografica della popol
- Page 19 and 20:
(il 2%) su 87.000 donne che svolgon
- Page 21 and 22:
più recente il grado di spopolamen
- Page 23 and 24:
di sfruttamento delle innovazioni,
- Page 25 and 26:
economica, le radici dell’afferma
- Page 27 and 28:
I comparti più rilevantiAgricoltur
- Page 29 and 30:
Due aspetti vanno evidenziati in co
- Page 31 and 32:
La collocazione territoriale del si
- Page 33 and 34:
Punti di forza e debolezza del Sist
- Page 35 and 36:
Impatto del precedente periodo di p
- Page 37 and 38:
STATO DI ESECUZIONE FINANZIARIA CON
- Page 39 and 40:
Reg.CE2081/93 Ob5B sottoprogramma 2
- Page 41 and 42:
Gli obiettivi generali del regolame
- Page 43 and 44:
potenziamento, la creazione di magg
- Page 45 and 46:
Coerenza interna del PianoIl Piano,
- Page 47 and 48:
gerarchia sono stati elaborate le m
- Page 50 and 51:
Nello specifico le priorità sono:1
- Page 52 and 53:
Piano forestale regionaleIl Piano f
- Page 54 and 55:
Locali. Esse costituiscono pertanto
- Page 56 and 57:
agronomica dei reflui zootecnici st
- Page 58 and 59:
La prima tipologia, generata dalla
- Page 60 and 61:
ATTUAZIONEStrategieL’analisi econ
- Page 62 and 63:
Quantificazione degli obiettiviGli
- Page 64:
PIANO FINANZIARIOSpesa complessivaL
- Page 67 and 68:
DESCRIZIONE DELLE MISUREElenco dell
- Page 69 and 70:
- Gestione del suolo sotto vincolo
- Page 71 and 72:
proprietà delle singole aziende ag
- Page 73 and 74:
MISURA 1.1.1 (a) - INVESTIMENTI NEL
- Page 75 and 76:
all’acquisizione di strumenti inf
- Page 77 and 78:
medesime clausole finanziarie, proc
- Page 79 and 80:
MISURA 1.1.3 (p) - DIVERSIFICAZIONE
- Page 81 and 82:
9. opere realizzate in ambito azien
- Page 83 and 84:
Condizioni dettagliate di eleggibil
- Page 85 and 86:
MISURA 1.1.4 (b) - INSEDIAMENTO DI
- Page 87 and 88:
E’ riconosciuto l’insediamento
- Page 89 and 90:
MISURA 1.1.5 (d) - PREPENSIONAMENTO
- Page 91 and 92:
(in EURO)2000 2001 2002 2003 2004 2
- Page 93 and 94:
MISURA 1.2.1 (g) - MIGLIORAMENTO DE
- Page 95 and 96:
dell’investimento per la sua dura
- Page 97 and 98:
g) Investimenti per la trasformazio
- Page 99 and 100:
) avviamento di organismi di commer
- Page 101 and 102:
MISURA 1.3.1 (l) - AVVIAMENTO DI SE
- Page 103 and 104:
esercizio, in modo che al quinto an
- Page 105 and 106:
alla presente azione saranno, preva
- Page 107 and 108:
sviluppino adeguate professionalit
- Page 109 and 110:
La dotazione finanziaria pubblica n
- Page 111 and 112:
Si conferma che le garanzie prestat
- Page 113 and 114:
− dati sull’importo totale dell
- Page 115 and 116:
È prevista una modulazione degli a
- Page 117 and 118:
MISURA 2.1.2 (f) - MISURE AGROAMBIE
- Page 119 and 120:
Gli importi dell’aiuto sono modul
- Page 121 and 122:
LocalizzazioneAcquiferi sensibili,
- Page 123 and 124:
Indicatori di impatto ambientaleVar
- Page 125 and 126:
Localizzazione:L’Azione sarà app
- Page 127 and 128:
- per l’olivo: Fecciaro, Raggio e
- Page 129 and 130:
BENEFICIARILa misura prevede la con
- Page 131 and 132:
IMPORTI UNITARI DEGLI AIUTI PER AZI
- Page 133 and 134:
ALLEGATO f.a “Dosi di riferimento
- Page 135 and 136:
COLTIVAZIONI ERBACEESCELTA DEL TERR
- Page 137 and 138:
COLTURE ORTICOLEAVVICENDAMENTOE’
- Page 139 and 140:
Sambucus nigraSpartiumTaxus baccata
- Page 141 and 142:
MISURA 2.1.3 (t) - TUTELA DELL’AM
- Page 143 and 144:
- migliorare e conservare i pascoli
- Page 145 and 146:
I contributi alle spese sono liquid
- Page 147 and 148:
INDICATORI FISICIAzione Indicatori
- Page 149 and 150:
Per il periodo di validità del Pia
- Page 151 and 152:
I contributi alle spese di impianto
- Page 153 and 154:
Allegato AElenco di riferimento del
- Page 155 and 156:
MISURA 2.2.2 (i) - ALTRE MISURE FOR
- Page 157 and 158: - di 1.016.000 EURO, di cui 508.000
- Page 159 and 160: - migliorare la capacità delle for
- Page 161 and 162: del consumo di combustibili fossili
- Page 163 and 164: per i consorzi fra privati o misti
- Page 165 and 166: Per l’azione d), trattandosi di i
- Page 167 and 168: INDICATORI FISICINr. beneficiariPr
- Page 169 and 170: mediante concessione di contributi
- Page 171 and 172: ispetto del “de minimis” di cui
- Page 173 and 174: Azione a)Azione b)Azione c)Azione d
- Page 175 and 176: Totale delle spese pubblicheTotale
- Page 177 and 178: Caratteristiche principaliIntensit
- Page 179 and 180: 1. interventi di ristrutturazione,
- Page 181 and 182: MISURA 3.3.2 (q) - GESTIONE DELLE R
- Page 183 and 184: interaziendali e collettivi.Sono co
- Page 185 and 186: AUTORITÀ COMPETENTI E ORGANISMI RE
- Page 187 and 188: Nella fase di attuazione, oltre all
- Page 189 and 190: LA CONCERTAZIONE E LA CONSULTAZIONE
- Page 191 and 192: −COOPERATIVE E OPERATORI AGRICOLI
- Page 193 and 194: APPENDICEPag. 193
- Page 195 and 196: Pag. 195
- Page 197 and 198: Pag. 197
- Page 199 and 200: Tabella 5 - Varietà e ruralità.De
- Page 201 and 202: Figura 1 - Transizioni intersettori
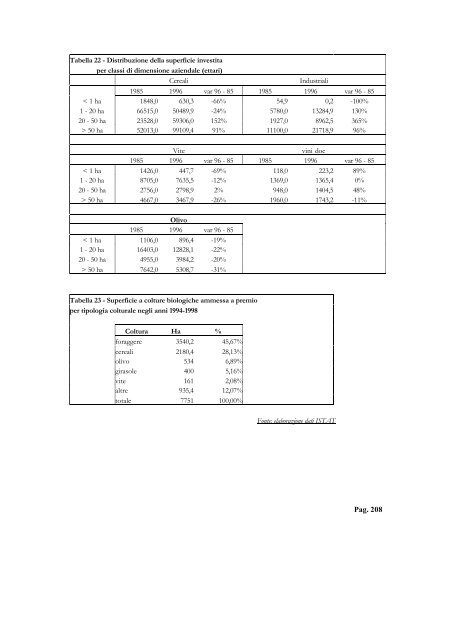
- Page 206 and 207: Pag. 206
- Page 210 and 211: Tabella 26a - Composizione PLV (pre
- Page 212 and 213: Pag. 212
- Page 214 and 215: Pag. 214
- Page 216: Pag. 216