

Maclean et al. - 2002 - Rice almanac source book for the most important e
Maclean et al. - 2002 - Rice almanac source book for the most important e
Maclean et al. - 2002 - Rice almanac source book for the most important e

Create successful ePaper yourself
Turn your PDF publications into a flip-book with our unique Google optimized e-Paper software.
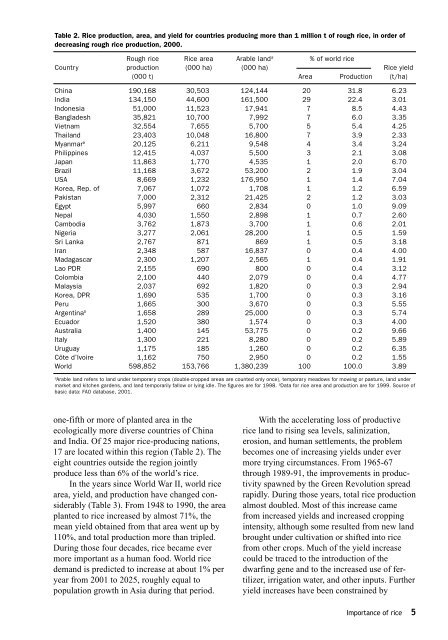
Table 2. <strong>Rice</strong> production, area, and yield <strong>for</strong> countries producing more than 1 million t of rough rice, in order of<br />
decreasing rough rice production, 2000.<br />
Rough rice <strong>Rice</strong> area Arable land a % of world rice<br />
Country production (000 ha) (000 ha) <strong>Rice</strong> yield<br />
(000 t) Area Production (t/ha)<br />
China 190,168 30,503 124,144 20 31.8 6.23<br />
India 134,150 44,600 161,500 29 22.4 3.01<br />
Indonesia 51,000 11,523 17,941 7 8.5 4.43<br />
Bangladesh 35,821 10,700 7,992 7 6.0 3.35<br />
Vi<strong>et</strong>nam 32,554 7,655 5,700 5 5.4 4.25<br />
Thailand 23,403 10,048 16,800 7 3.9 2.33<br />
Myanmar b 20,125 6,211 9,548 4 3.4 3.24<br />
Philippines 12,415 4,037 5,500 3 2.1 3.08<br />
Japan 11,863 1,770 4,535 1 2.0 6.70<br />
Brazil 11,168 3,672 53,200 2 1.9 3.04<br />
USA 8,669 1,232 176,950 1 1.4 7.04<br />
Korea, Rep. of7,067 1,072 1,708 1 1.2 6.59<br />
Pakistan 7,000 2,312 21,425 2 1.2 3.03<br />
Egypt 5,997 660 2,834 0 1.0 9.09<br />
Nep<strong>al</strong> 4,030 1,550 2,898 1 0.7 2.60<br />
Cambodia 3,762 1,873 3,700 1 0.6 2.01<br />
Nigeria 3,277 2,061 28,200 1 0.5 1.59<br />
Sri Lanka 2,767 871 869 1 0.5 3.18<br />
Iran 2,348 587 16,837 0 0.4 4.00<br />
Madagascar 2,300 1,207 2,565 1 0.4 1.91<br />
Lao PDR 2,155 690 800 0 0.4 3.12<br />
Colombia 2,100 440 2,079 0 0.4 4.77<br />
M<strong>al</strong>aysia 2,037 692 1,820 0 0.3 2.94<br />
Korea, DPR 1,690 535 1,700 0 0.3 3.16<br />
Peru 1,665 300 3,670 0 0.3 5.55<br />
Argentina b 1,658 289 25,000 0 0.3 5.74<br />
Ecuador 1,520 380 1,574 0 0.3 4.00<br />
Austr<strong>al</strong>ia 1,400 145 53,775 0 0.2 9.66<br />
It<strong>al</strong>y 1,300 221 8,280 0 0.2 5.89<br />
Uruguay 1,175 185 1,260 0 0.2 6.35<br />
Côte d’Ivoire 1,162 750 2,950 0 0.2 1.55<br />
World 598,852 153,766 1,380,239 100 100.0 3.89<br />
a<br />
Arable land refers to land under temporar y crops (double-cropped areas are counted only once), temporar y meadows <strong>for</strong> mowing or pasture, land under<br />
mark<strong>et</strong> and kitchen gardens, and land temporarily f<strong>al</strong>low or lying idle. The figures are <strong>for</strong> 1998. b Data <strong>for</strong> rice area and production are <strong>for</strong> 1999. Source of<br />
basic data: FAO database, 2001.<br />
one-fifth or more of planted area in <strong>the</strong><br />
ecologic<strong>al</strong>ly more diverse countries of China<br />
and India. Of 25 major rice-producing nations,<br />
17 are located within this region (Table 2). The<br />
eight countries outside <strong>the</strong> region jointly<br />
produce less than 6% of <strong>the</strong> world’s rice.<br />
In <strong>the</strong> years since World War II, world rice<br />
area, yield, and production have changed considerably<br />
(Table 3). From 1948 to 1990, <strong>the</strong> area<br />
planted to rice increased by <strong>al</strong><strong>most</strong> 71%, <strong>the</strong><br />
mean yield obtained from that area went up by<br />
110%, and tot<strong>al</strong> production more than tripled.<br />
During those four decades, rice became ever<br />
more <strong>important</strong> as a human food. World rice<br />
demand is predicted to increase at about 1% per<br />
year from 2001 to 2025, roughly equ<strong>al</strong> to<br />
population growth in Asia during that period.<br />
With <strong>the</strong> accelerating loss of productive<br />
rice land to rising sea levels, s<strong>al</strong>inization,<br />
erosion, and human s<strong>et</strong>tlements, <strong>the</strong> problem<br />
becomes one of increasing yields under ever<br />
more trying circumstances. From 1965-67<br />
through 1989-91, <strong>the</strong> improvements in productivity<br />
spawned by <strong>the</strong> Green Revolution spread<br />
rapidly. During those years, tot<strong>al</strong> rice production<br />
<strong>al</strong><strong>most</strong> doubled. Most of this increase came<br />
from increased yields and increased cropping<br />
intensity, <strong>al</strong>though some resulted from new land<br />
brought under cultivation or shifted into rice<br />
from o<strong>the</strong>r crops. Much of <strong>the</strong> yield increase<br />
could be traced to <strong>the</strong> introduction of <strong>the</strong><br />
dwarfing gene and to <strong>the</strong> increased use of fertilizer,<br />
irrigation water, and o<strong>the</strong>r inputs. Fur<strong>the</strong>r<br />
yield increases have been constrained by<br />
Importance of rice 5


