

Maclean et al. - 2002 - Rice almanac source book for the most important e
Maclean et al. - 2002 - Rice almanac source book for the most important e
Maclean et al. - 2002 - Rice almanac source book for the most important e

Create successful ePaper yourself
Turn your PDF publications into a flip-book with our unique Google optimized e-Paper software.
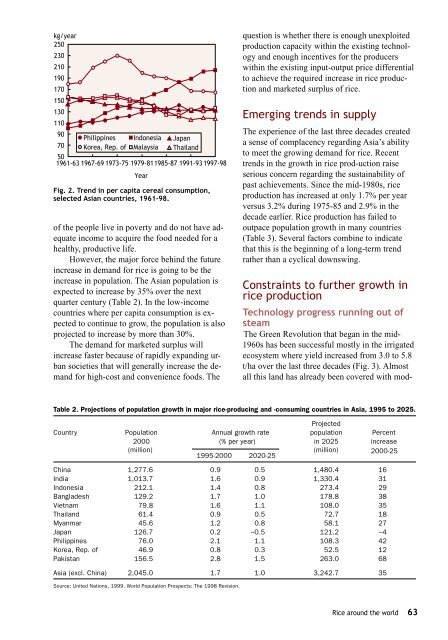
kg/year<br />
250<br />
230<br />
210<br />
190<br />
170<br />
150<br />
130<br />
110<br />
90<br />
70<br />
Philippines<br />
Korea, Rep. of<br />
Indonesia<br />
M<strong>al</strong>aysia<br />
Japan<br />
Thailand<br />
50<br />
1961-631967-69 1973-75 1979-811985-87 1991-931997-98<br />
Year<br />
Fig. 2. Trend in per capita cere<strong>al</strong> consumption,<br />
selected Asian countries, 1961-98.<br />
of <strong>the</strong> people live in poverty and do not have adequate<br />
income to acquire <strong>the</strong> food needed <strong>for</strong> a<br />
he<strong>al</strong>thy, productive life.<br />
However, <strong>the</strong> major <strong>for</strong>ce behind <strong>the</strong> future<br />
increase in demand <strong>for</strong> rice is going to be <strong>the</strong><br />
increase in population. The Asian population is<br />
expected to increase by 35% over <strong>the</strong> next<br />
quarter century (Table 2). In <strong>the</strong> low-income<br />
countries where per capita consumption is expected<br />
to continue to grow, <strong>the</strong> population is <strong>al</strong>so<br />
projected to increase by more than 30%.<br />
The demand <strong>for</strong> mark<strong>et</strong>ed surplus will<br />
increase faster because of rapidly expanding urban<br />
soci<strong>et</strong>ies that will gener<strong>al</strong>ly increase <strong>the</strong> demand<br />
<strong>for</strong> high-cost and convenience foods. The<br />
question is wh<strong>et</strong>her <strong>the</strong>re is enough unexploited<br />
production capacity within <strong>the</strong> existing technology<br />
and enough incentives <strong>for</strong> <strong>the</strong> producers<br />
within <strong>the</strong> existing input-output price differenti<strong>al</strong><br />
to achieve <strong>the</strong> required increase in rice production<br />
and mark<strong>et</strong>ed surplus of rice.<br />
Emerging trends in supply<br />
The experience of <strong>the</strong> last three decades created<br />
a sense of complacency regarding Asia’s ability<br />
to me<strong>et</strong> <strong>the</strong> growing demand <strong>for</strong> rice. Recent<br />
trends in <strong>the</strong> growth in rice prod-uction raise<br />
serious concern regarding <strong>the</strong> sustainability of<br />
past achievements. Since <strong>the</strong> mid-1980s, rice<br />
production has increased at only 1.7% per year<br />
versus 3.2% during 1975-85 and 2.9% in <strong>the</strong><br />
decade earlier. <strong>Rice</strong> production has failed to<br />
outpace population growth in many countries<br />
(Table 3). Sever<strong>al</strong> factors combine to indicate<br />
that this is <strong>the</strong> beginning of a long-term trend<br />
ra<strong>the</strong>r than a cyclic<strong>al</strong> downswing.<br />
Constraints to fur<strong>the</strong>r growth in<br />
rice production<br />
Technology progress running out of<br />
steam<br />
The Green Revolution that began in <strong>the</strong> mid-<br />
1960s has been successful <strong>most</strong>ly in <strong>the</strong> irrigated<br />
ecosystem where yield increased from 3.0 to 5.8<br />
t/ha over <strong>the</strong> last three decades (Fig. 3). Al<strong>most</strong><br />
<strong>al</strong>l this land has <strong>al</strong>ready been covered with mod-<br />
Table 2. Projections of population growth in major rice-producing and -consuming countries in Asia, 1995 to 2025.<br />
Projected<br />
Country Population Annu<strong>al</strong> growth rate population Percent<br />
2000 (% per year) in 2025 increase<br />
(million)<br />
1995-2000 2020-25<br />
(million) 2000-25<br />
China 1,277.6 0.9 0.5 1,480.4 16<br />
India 1,013.7 1.6 0.9 1,330.4 31<br />
Indonesia 212.1 1.4 0.8 273.4 29<br />
Bangladesh 129.2 1.7 1.0 178.8 38<br />
Vi<strong>et</strong>nam 79.8 1.6 1.1 108.0 35<br />
Thailand 61.4 0.9 0.5 72.7 18<br />
Myanmar 45.6 1.2 0.8 58.1 27<br />
Japan 126.7 0.2 –0.5 121.2 –4<br />
Philippines 76.0 2.1 1.1 108.3 42<br />
Korea, Rep. of 46.9 0.8 0.3 52.5 12<br />
Pakistan 156.5 2.8 1.5 263.0 68<br />
Asia (excl. China) 2,045.0 1.7 1.0 3,242.7 35<br />
Source: United Nations, 1999. World Population Prospects: The 1998 Revision.<br />
<strong>Rice</strong> around <strong>the</strong> world 63


