

Maclean et al. - 2002 - Rice almanac source book for the most important e
Maclean et al. - 2002 - Rice almanac source book for the most important e
Maclean et al. - 2002 - Rice almanac source book for the most important e

You also want an ePaper? Increase the reach of your titles
YUMPU automatically turns print PDFs into web optimized ePapers that Google loves.
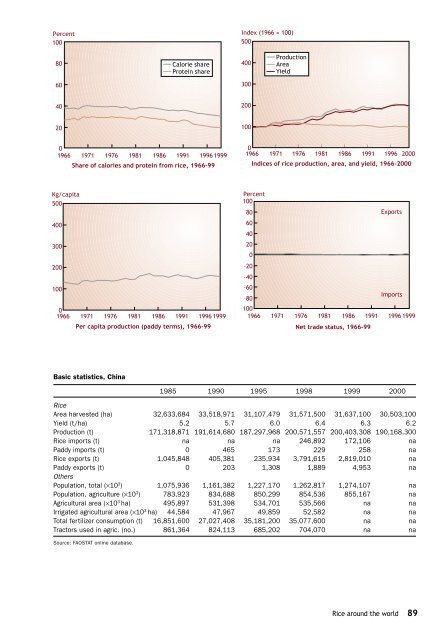
Percent<br />
100<br />
Index (1966 = 100)<br />
500<br />
80<br />
C<strong>al</strong>orie share<br />
Protein share<br />
400<br />
Production<br />
Area<br />
Yield<br />
60<br />
300<br />
40<br />
200<br />
20<br />
100<br />
0<br />
1966 1971 1976 1981 1986 1991 1996 1999<br />
Share of c<strong>al</strong>ories and protein from rice, 1966-99<br />
0<br />
1966 1971 1976 1981 1986 1991 1996 2000<br />
Indices of rice production, area, and yield, 1966-2000<br />
Kg/capita<br />
500<br />
400<br />
300<br />
200<br />
100<br />
0<br />
1966 1971 1976 1981 1986 1991 1996 1999<br />
Per capita production (paddy terms), 1966-99<br />
Percent<br />
100<br />
80<br />
Exports<br />
60<br />
40<br />
20<br />
0<br />
–20<br />
–40<br />
–60<br />
Imports<br />
–80<br />
–100<br />
1966 1971 1976 1981 1986 1991 1996 1999<br />
N<strong>et</strong> trade status, 1966-99<br />
Basic statistics, China<br />
1985 1990 1995 1998 1999 2000<br />
<strong>Rice</strong><br />
Area harvested (ha) 32,633,684 33,518,971 31,107,479 31,571,500 31,637,100 30,503,100<br />
Yield (t/ha) 5.2 5.7 6.0 6.4 6.3 6.2<br />
Production (t) 171,318,871 191,614,680 187,297,968 200,571,557 200,403,308 190,168,300<br />
<strong>Rice</strong> imports (t) na na na 246,892 172,106 na<br />
Paddy imports (t) 0 465 173 229 258 na<br />
<strong>Rice</strong> exports (t) 1,045,848 405,381 235,934 3,791,615 2,819,010 na<br />
Paddy exports (t) 0 203 1,308 1,889 4,953 na<br />
O<strong>the</strong>rs<br />
Population, tot<strong>al</strong> (×10 3 ) 1,075,936 1,161,382 1,227,170 1,262,817 1,274,107 na<br />
Population, agriculture (×10 3 ) 783,923 834,688 850,299 854,536 855,167 na<br />
Agricultur<strong>al</strong> area (×10 3 ha) 495,897 531,398 534,701 535,566 na na<br />
Irrigated agricultur<strong>al</strong> area (×10 3 ha) 44,584 47,967 49,859 52,582 na na<br />
Tot<strong>al</strong> fertilizer consumption (t) 16,851,600 27,027,408 35,181,200 35,077,600 na na<br />
Tractors used in agric. (no.) 861,364 824,113 685,202 704,070 na na<br />
Source: FAOSTAT online database.<br />
<strong>Rice</strong> around <strong>the</strong> world 89


