

Maclean et al. - 2002 - Rice almanac source book for the most important e
Maclean et al. - 2002 - Rice almanac source book for the most important e
Maclean et al. - 2002 - Rice almanac source book for the most important e

You also want an ePaper? Increase the reach of your titles
YUMPU automatically turns print PDFs into web optimized ePapers that Google loves.
Percent<br />
100<br />
Index (1966 = 100)<br />
900<br />
80<br />
60<br />
C<strong>al</strong>orie share<br />
Protein share<br />
700<br />
500<br />
40<br />
20<br />
300<br />
100<br />
Production<br />
Area<br />
Yield<br />
0<br />
1966 1971 1976 1981 1986 1991 1996 1999<br />
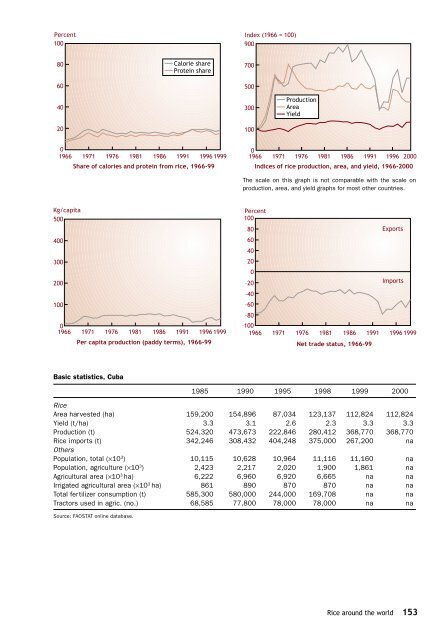
Share of c<strong>al</strong>ories and protein from rice, 1966-99<br />
0<br />
1966 1971 1976 1981 1986 1991 1996 2000<br />
Indices of rice production, area, and yield, 1966-2000<br />
The sc<strong>al</strong>e on this graph is not comparable with <strong>the</strong> sc<strong>al</strong>e on<br />
production, area, and yield graphs <strong>for</strong> <strong>most</strong> o<strong>the</strong>r countries.<br />
Kg/capita<br />
500<br />
400<br />
300<br />
200<br />
100<br />
0<br />
1966 1971 1976 1981 1986 1991 1996 1999<br />
Per capita production (paddy terms), 1966-99<br />
Percent<br />
100<br />
80<br />
Exports<br />
60<br />
40<br />
20<br />
0<br />
–20<br />
Imports<br />
–40<br />
–60<br />
–80<br />
–100<br />
1966 1971 1976 1981 1986 1991 1996 1999<br />
N<strong>et</strong> trade status, 1966-99<br />
Basic statistics, Cuba<br />
1985 1990 1995 1998 1999 2000<br />
<strong>Rice</strong><br />
Area harvested (ha) 159,200 154,896 87,034 123,137 112,824 112,824<br />
Yield (t/ha) 3.3 3.1 2.6 2.3 3.3 3.3<br />
Production (t) 524,320 473,673 222,846 280,412 368,770 368,770<br />
<strong>Rice</strong> imports (t) 342,246 308,432 404,248 375,000 267,200 na<br />
O<strong>the</strong>rs<br />
Population, tot<strong>al</strong> (×10 3 ) 10,115 10,628 10,96411,116 11,160 na<br />
Population, agriculture (×10 3 ) 2,423 2,217 2,020 1,900 1,861 na<br />
Agricultur<strong>al</strong> area (×10 3 ha) 6,222 6,960 6,920 6,665 na na<br />
Irrigated agricultur<strong>al</strong> area (×10 3 ha) 861 890 870 870 na na<br />
Tot<strong>al</strong> fertilizer consumption (t) 585,300 580,000 244,000 169,708 na na<br />
Tractors used in agric. (no.) 68,585 77,800 78,000 78,000 na na<br />
Source: FAOSTAT online database.<br />
<strong>Rice</strong> around <strong>the</strong> world 153


