

Maclean et al. - 2002 - Rice almanac source book for the most important e
Maclean et al. - 2002 - Rice almanac source book for the most important e
Maclean et al. - 2002 - Rice almanac source book for the most important e

Create successful ePaper yourself
Turn your PDF publications into a flip-book with our unique Google optimized e-Paper software.
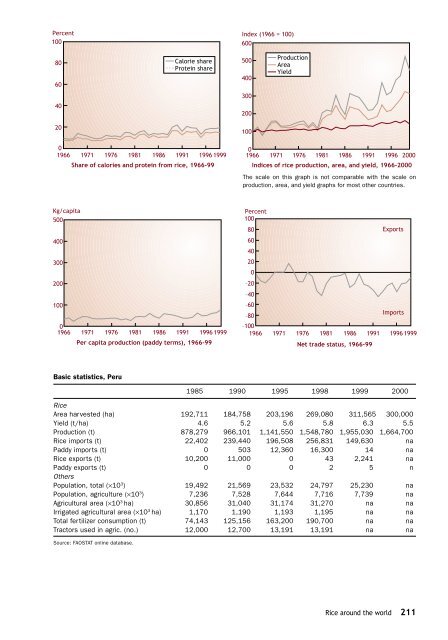
Percent<br />
100<br />
Index (1966 = 100)<br />
600<br />
80<br />
60<br />
C<strong>al</strong>orie share<br />
Protein share<br />
500<br />
400<br />
Production<br />
Area<br />
Yield<br />
300<br />
40<br />
200<br />
20<br />
100<br />
0<br />
1966 1971 1976 1981 1986 1991 1996 1999<br />
Share of c<strong>al</strong>ories and protein from rice, 1966-99<br />
0<br />
1966 1971 1976 1981 1986 1991 1996 2000<br />
Indices of rice production, area, and yield, 1966-2000<br />
The sc<strong>al</strong>e on this graph is not comparable with <strong>the</strong> sc<strong>al</strong>e on<br />
production, area, and yield graphs <strong>for</strong> <strong>most</strong> o<strong>the</strong>r countries.<br />
Kg/capita<br />
500<br />
400<br />
300<br />
200<br />
100<br />
0<br />
1966 1971 1976 1981 1986 1991 1996 1999<br />
Per capita production (paddy terms), 1966-99<br />
Percent<br />
100<br />
80<br />
Exports<br />
60<br />
40<br />
20<br />
0<br />
–20<br />
–40<br />
–60<br />
Imports<br />
–80<br />
–100<br />
1966 1971 1976 1981 1986 1991 1996 1999<br />
N<strong>et</strong> trade status, 1966-99<br />
Basic statistics, Peru<br />
1985 1990 1995 1998 1999 2000<br />
<strong>Rice</strong><br />
Area harvested (ha) 192,711 184,758 203,196 269,080 311,565 300,000<br />
Yield (t/ha) 4.6 5.2 5.6 5.8 6.3 5.5<br />
Production (t) 878,279 966,101 1,141,550 1,548,780 1,955,030 1,664,700<br />
<strong>Rice</strong> imports (t) 22,402 239,440 196,508 256,831 149,630 na<br />
Paddy imports (t) 0 503 12,360 16,300 14 na<br />
<strong>Rice</strong> exports (t) 10,200 11,000 0 43 2,241 na<br />
Paddy exports (t) 0 0 0 2 5 n<br />
O<strong>the</strong>rs<br />
Population, tot<strong>al</strong> (×10 3 ) 19,492 21,569 23,532 24,797 25,230 na<br />
Population, agriculture (×10 3 ) 7,236 7,528 7,644 7,716 7,739 na<br />
Agricultur<strong>al</strong> area (×10 3 ha) 30,856 31,040 31,174 31,270 na na<br />
Irrigated agricultur<strong>al</strong> area (×10 3 ha) 1,170 1,190 1,193 1,195 na na<br />
Tot<strong>al</strong> fertilizer consumption (t) 74,143 125,156 163,200 190,700 na na<br />
Tractors used in agric. (no.) 12,000 12,700 13,191 13,191 na na<br />
Source: FAOSTAT online database.<br />
<strong>Rice</strong> around <strong>the</strong> world 211


