

Maclean et al. - 2002 - Rice almanac source book for the most important e
Maclean et al. - 2002 - Rice almanac source book for the most important e
Maclean et al. - 2002 - Rice almanac source book for the most important e

Create successful ePaper yourself
Turn your PDF publications into a flip-book with our unique Google optimized e-Paper software.
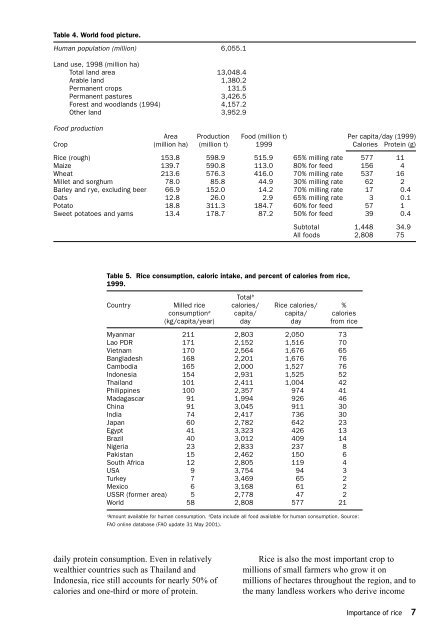
Table 4. World food picture.<br />
Human population (million) 6,055.1<br />
Land use, 1998 (million ha)<br />
Tot<strong>al</strong> land area 13,048.4<br />
Arable land 1,380.2<br />
Permanent crops 131.5<br />
Permanent pastures 3,426.5<br />
Forest and woodlands (1994) 4,157.2<br />
O<strong>the</strong>r land 3,952.9<br />
Food production<br />
Area Production Food (million t) Per capita/day (1999)<br />
Crop (million ha) (million t) 1999 C<strong>al</strong>ories Protein (g)<br />
<strong>Rice</strong> (rough) 153.8 598.9 515.9 65% milling rate 577 11<br />
Maize 139.7 590.8 113.0 80% <strong>for</strong> feed 156 4<br />
Wheat 213.6 576.3 416.0 70% milling rate 537 16<br />
Mill<strong>et</strong> and sorghum 78.0 85.8 44.9 30% milling rate 62 2<br />
Barley and rye, excluding beer 66.9 152.0 14.2 70% milling rate 17 0.4<br />
Oats 12.8 26.0 2.9 65% milling rate 3 0.1<br />
Potato 18.8 311.3 184.7 60% <strong>for</strong> feed 57 1<br />
Swe<strong>et</strong> potatoes and yams 13.4 178.7 87.2 50% <strong>for</strong> feed 39 0.4<br />
Subtot<strong>al</strong> 1,448 34.9<br />
All foods 2,808 75<br />
Table 5. <strong>Rice</strong> consumption, c<strong>al</strong>oric intake, and percent of c<strong>al</strong>ories from rice,<br />
1999.<br />
Tot<strong>al</strong> b<br />
Country Milled rice c<strong>al</strong>ories/ <strong>Rice</strong> c<strong>al</strong>ories/ %<br />
consumption a capita/ capita/ c<strong>al</strong>ories<br />
(kg/capita/year) day day from rice<br />
Myanmar 211 2,803 2,050 73<br />
Lao PDR 171 2,152 1,516 70<br />
Vi<strong>et</strong>nam 170 2,564 1,676 65<br />
Bangladesh 168 2,201 1,676 76<br />
Cambodia 165 2,000 1,527 76<br />
Indonesia 154 2,931 1,525 52<br />
Thailand 101 2,411 1,004 42<br />
Philippines 100 2,357 974 41<br />
Madagascar 91 1,994 926 46<br />
China 91 3,045 911 30<br />
India 74 2,417 736 30<br />
Japan 60 2,782 642 23<br />
Egypt 41 3,323 426 13<br />
Brazil 40 3,012 409 14<br />
Nigeria 23 2,833 237 8<br />
Pakistan 15 2,462 150 6<br />
South Africa 12 2,805 119 4<br />
USA 9 3,754 94 3<br />
Turkey 7 3,469 65 2<br />
Mexico 6 3,168 61 2<br />
USSR (<strong>for</strong>mer area) 5 2,778 47 2<br />
World 58 2,808 577 21<br />
a<br />
Amount available <strong>for</strong> human consumption. b Data include <strong>al</strong>l food available <strong>for</strong> human consumption. Source:<br />
FAO online database (FAO update 31 May 2001).<br />
daily protein consumption. Even in relatively<br />
we<strong>al</strong>thier countries such as Thailand and<br />
Indonesia, rice still accounts <strong>for</strong> nearly 50% of<br />
c<strong>al</strong>ories and one-third or more of protein.<br />
<strong>Rice</strong> is <strong>al</strong>so <strong>the</strong> <strong>most</strong> <strong>important</strong> crop to<br />
millions of sm<strong>al</strong>l farmers who grow it on<br />
millions of hectares throughout <strong>the</strong> region, and to<br />
<strong>the</strong> many landless workers who derive income<br />
Importance of rice 7


