

Maclean et al. - 2002 - Rice almanac source book for the most important e
Maclean et al. - 2002 - Rice almanac source book for the most important e
Maclean et al. - 2002 - Rice almanac source book for the most important e

Create successful ePaper yourself
Turn your PDF publications into a flip-book with our unique Google optimized e-Paper software.
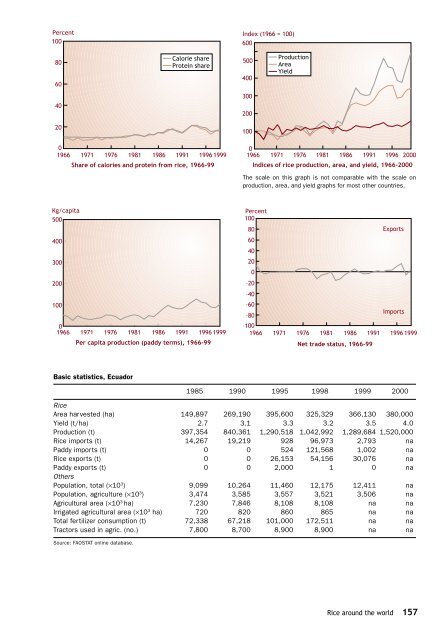
Percent<br />
100<br />
Index (1966 = 100)<br />
600<br />
80<br />
60<br />
C<strong>al</strong>orie share<br />
Protein share<br />
500<br />
400<br />
Production<br />
Area<br />
Yield<br />
40<br />
300<br />
200<br />
20<br />
100<br />
0<br />
1966 1971 1976 1981 1986 1991 1996 1999<br />
Share of c<strong>al</strong>ories and protein from rice, 1966-99<br />
0<br />
1966 1971 1976 1981 1986 1991 1996 2000<br />
Indices of rice production, area, and yield, 1966-2000<br />
The sc<strong>al</strong>e on this graph is not comparable with <strong>the</strong> sc<strong>al</strong>e on<br />
production, area, and yield graphs <strong>for</strong> <strong>most</strong> o<strong>the</strong>r countries.<br />
Kg/capita<br />
500<br />
400<br />
300<br />
200<br />
100<br />
0<br />
1966 1971 1976 1981 1986 1991 1996 1999<br />
Per capita production (paddy terms), 1966-99<br />
Percent<br />
100<br />
80<br />
Exports<br />
60<br />
40<br />
20<br />
0<br />
–20<br />
–40<br />
–60<br />
Imports<br />
–80<br />
–100<br />
1966 1971 1976 1981 1986 1991 1996 1999<br />
N<strong>et</strong> trade status, 1966-99<br />
Basic statistics, Ecuador<br />
1985 1990 1995 1998 1999 2000<br />
<strong>Rice</strong><br />
Area harvested (ha) 149,897 269,190 395,600 325,329 366,130 380,000<br />
Yield (t/ha) 2.7 3.1 3.3 3.2 3.5 4.0<br />
Production (t) 397,354 840,361 1,290,518 1,042,992 1,289,684 1,520,000<br />
<strong>Rice</strong> imports (t) 14,267 19,219 928 96,973 2,793 na<br />
Paddy imports (t) 0 0 524 121,568 1,002 na<br />
<strong>Rice</strong> exports (t) 0 0 26,153 54,156 30,076 na<br />
Paddy exports (t) 0 0 2,000 1 0 na<br />
O<strong>the</strong>rs<br />
Population, tot<strong>al</strong> (×10 3 ) 9,099 10,264 11,460 12,175 12,411 na<br />
Population, agriculture (×10 3 ) 3,474 3,585 3,557 3,521 3,506 na<br />
Agricultur<strong>al</strong> area (×10 3 ha) 7,230 7,846 8,108 8,108 na na<br />
Irrigated agricultur<strong>al</strong> area (×10 3 ha) 720 820 860 865 na na<br />
Tot<strong>al</strong> fertilizer consumption (t) 72,338 67,218 101,000 172,511 na na<br />
Tractors used in agric. (no.) 7,800 8,700 8,900 8,900 na na<br />
Source: FAOSTAT online database.<br />
<strong>Rice</strong> around <strong>the</strong> world 157


