

Maclean et al. - 2002 - Rice almanac source book for the most important e
Maclean et al. - 2002 - Rice almanac source book for the most important e
Maclean et al. - 2002 - Rice almanac source book for the most important e

Create successful ePaper yourself
Turn your PDF publications into a flip-book with our unique Google optimized e-Paper software.
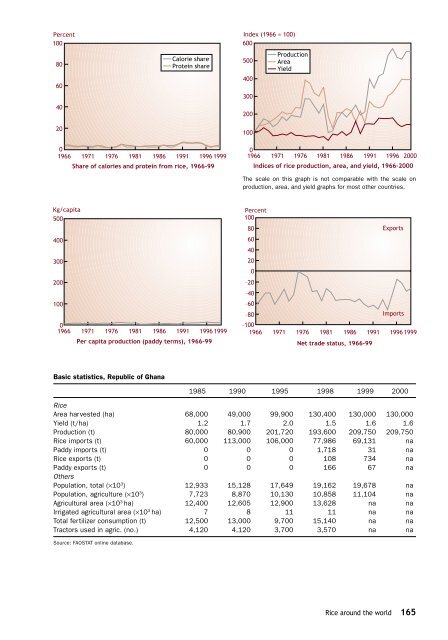
Percent<br />
100<br />
80<br />
60<br />
40<br />
20<br />
C<strong>al</strong>orie share<br />
Protein share<br />
Index (1966 = 100)<br />
600<br />
500<br />
400<br />
300<br />
200<br />
100<br />
Production<br />
Area<br />
Yield<br />
0<br />
1966 1971 1976 1981 1986 1991 1996 1999<br />
Share of c<strong>al</strong>ories and protein from rice, 1966-99<br />
0<br />
1966 1971 1976 1981 1986 1991 1996 2000<br />
Indices of rice production, area, and yield, 1966-2000<br />
The sc<strong>al</strong>e on this graph is not comparable with <strong>the</strong> sc<strong>al</strong>e on<br />
production, area, and yield graphs <strong>for</strong> <strong>most</strong> o<strong>the</strong>r countries.<br />
Kg/capita<br />
500<br />
400<br />
300<br />
200<br />
100<br />
0<br />
1966 1971 1976 1981 1986 1991 1996 1999<br />
Per capita production (paddy terms), 1966-99<br />
Percent<br />
100<br />
80<br />
Exports<br />
60<br />
40<br />
20<br />
0<br />
–20<br />
–40<br />
–60<br />
–80<br />
Imports<br />
–100<br />
1966 1971 1976 1981 1986 1991 1996 1999<br />
N<strong>et</strong> trade status, 1966-99<br />
Basic statistics, Republic of Ghana<br />
1985 1990 1995 1998 1999 2000<br />
<strong>Rice</strong><br />
Area harvested (ha) 68,000 49,000 99,900 130,400 130,000 130,000<br />
Yield (t/ha) 1.2 1.7 2.0 1.5 1.6 1.6<br />
Production (t) 80,000 80,900 201,720 193,600 209,750 209,750<br />
<strong>Rice</strong> imports (t) 60,000 113,000 106,000 77,986 69,131 na<br />
Paddy imports (t) 0 0 0 1,718 31 na<br />
<strong>Rice</strong> exports (t) 0 0 0 108 734 na<br />
Paddy exports (t) 0 0 0 166 67 na<br />
O<strong>the</strong>rs<br />
Population, tot<strong>al</strong> (×10 3 ) 12,933 15,128 17,649 19,162 19,678 na<br />
Population, agriculture (×10 3 ) 7,723 8,870 10,130 10,858 11,104 na<br />
Agricultur<strong>al</strong> area (×10 3 ha) 12,400 12,605 12,900 13,628 na na<br />
Irrigated agricultur<strong>al</strong> area (×10 3 ha) 7 8 11 11 na na<br />
Tot<strong>al</strong> fertilizer consumption (t) 12,500 13,000 9,700 15,140 na na<br />
Tractors used in agric. (no.) 4,120 4,120 3,700 3,570 na na<br />
Source: FAOSTAT online database.<br />
<strong>Rice</strong> around <strong>the</strong> world 165


