

Maclean et al. - 2002 - Rice almanac source book for the most important e
Maclean et al. - 2002 - Rice almanac source book for the most important e
Maclean et al. - 2002 - Rice almanac source book for the most important e

Create successful ePaper yourself
Turn your PDF publications into a flip-book with our unique Google optimized e-Paper software.
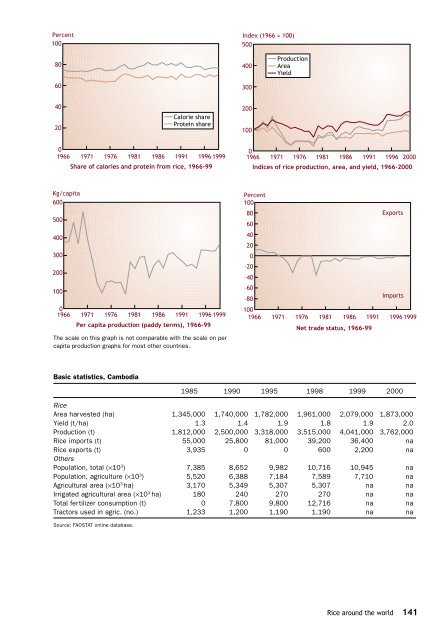
Percent<br />
100<br />
Index (1966 = 100)<br />
500<br />
80<br />
60<br />
400<br />
300<br />
Production<br />
Area<br />
Yield<br />
40<br />
20<br />
C<strong>al</strong>orie share<br />
Protein share<br />
200<br />
100<br />
0<br />
1966 1971 1976 1981 1986 1991 1996 1999<br />
Share of c<strong>al</strong>ories and protein from rice, 1966-99<br />
0<br />
1966 1971 1976 1981 1986 1991 1996 2000<br />
Indices of rice production, area, and yield, 1966-2000<br />
Kg/capita<br />
600<br />
500<br />
400<br />
300<br />
200<br />
100<br />
0<br />
1966 1971 1976 1981 1986 1991 1996 1999<br />
Per capita production (paddy terms), 1966-99<br />
The sc<strong>al</strong>e on this graph is not comparable with <strong>the</strong> sc<strong>al</strong>e on per<br />
capita production graphs <strong>for</strong> <strong>most</strong> o<strong>the</strong>r countries.<br />
Percent<br />
100<br />
80<br />
Exports<br />
60<br />
40<br />
20<br />
0<br />
–20<br />
–40<br />
–60<br />
Imports<br />
–80<br />
–100<br />
1966 1971 1976 1981 1986 1991 1996 1999<br />
N<strong>et</strong> trade status, 1966-99<br />
Basic statistics, Cambodia<br />
1985 1990 1995 1998 1999 2000<br />
<strong>Rice</strong><br />
Area harvested (ha)1,345,000 1,740,000 1,782,000 1,961,000 2,079,000 1,873,000<br />
Yield (t/ha)1.3 1.4 1.9 1.8 1.9 2.0<br />
Production (t)1,812,000 2,500,000 3,318,000 3,515,000 4,041,000 3,762,000<br />
<strong>Rice</strong> imports (t)55,000 25,800 81,000 39,200 36,400 na<br />
<strong>Rice</strong> exports (t)3,935 0 0 600 2,200 na<br />
O<strong>the</strong>rs<br />
Population, tot<strong>al</strong> (×10 3 )7,385 8,652 9,982 10,716 10,945 na<br />
Population, agriculture (×10 3 )5,520 6,388 7,184 7,589 7,710 na<br />
Agricultur<strong>al</strong> area (×10 3 ha)3,170 5,349 5,307 5,307 na na<br />
Irrigated agricultur<strong>al</strong> area (×10 3 ha)180 240 270 270 na na<br />
Tot<strong>al</strong> fertilizer consumption (t)0 7,800 9,800 12,716 na na<br />
Tractors used in agric. (no.)1,233 1,200 1,190 1,190 na na<br />
Source: FAOSTAT online database.<br />
<strong>Rice</strong> around <strong>the</strong> world 141


