

Maclean et al. - 2002 - Rice almanac source book for the most important e
Maclean et al. - 2002 - Rice almanac source book for the most important e
Maclean et al. - 2002 - Rice almanac source book for the most important e

Create successful ePaper yourself
Turn your PDF publications into a flip-book with our unique Google optimized e-Paper software.
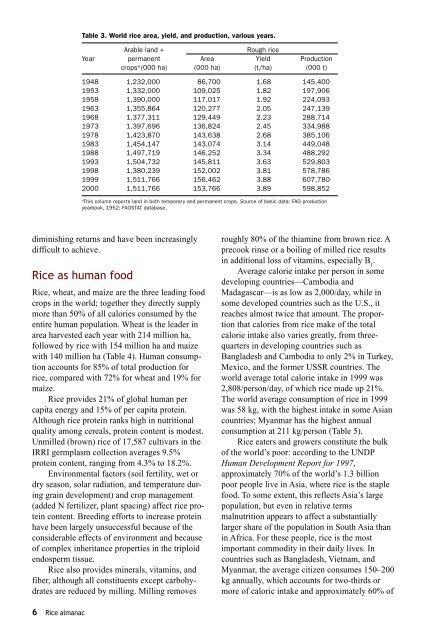
Table 3. World rice area, yield, and production, various years.<br />
Arable land +<br />
Rough rice<br />
Year permanent Area Yield Production<br />
crops a (000 ha) (000 ha) (t/ha) (000 t)<br />
1948 1,232,000 86,700 1.68 145,400<br />
1953 1,332,000 109,025 1.82 197,906<br />
1958 1,390,000 117,017 1.92 224,093<br />
1963 1,355,864 120,277 2.05 247,139<br />
1968 1,377,311 129,449 2.23 288,714<br />
1973 1,397,696 136,824 2.45 334,988<br />
1978 1,423,870 143,638 2.68 385,106<br />
1983 1,454,147 143,074 3.14 449,048<br />
1988 1,497,719 146,252 3.34 488,292<br />
1993 1,504,732 145,811 3.63 529,803<br />
1998 1,380,239 152,002 3.81 578,786<br />
1999 1,511,766 156,462 3.88 607,780<br />
2000 1,511,766 153,766 3.89 598,852<br />
a<br />
This column reports land in both temporary and permanent crops. Source of basic data: FAO production<br />
year<strong>book</strong>, 1952; FAOSTAT database.<br />
diminishing r<strong>et</strong>urns and have been increasingly<br />
difficult to achieve.<br />
<strong>Rice</strong> as human food<br />
<strong>Rice</strong>, wheat, and maize are <strong>the</strong> three leading food<br />
crops in <strong>the</strong> world; tog<strong>et</strong>her <strong>the</strong>y directly supply<br />
more than 50% of <strong>al</strong>l c<strong>al</strong>ories consumed by <strong>the</strong><br />
entire human population. Wheat is <strong>the</strong> leader in<br />
area harvested each year with 214 million ha,<br />
followed by rice with 154 million ha and maize<br />
with 140 million ha (Table 4). Human consumption<br />
accounts <strong>for</strong> 85% of tot<strong>al</strong> production <strong>for</strong><br />
rice, compared with 72% <strong>for</strong> wheat and 19% <strong>for</strong><br />
maize.<br />
<strong>Rice</strong> provides 21% of glob<strong>al</strong> human per<br />
capita energy and 15% of per capita protein.<br />
Although rice protein ranks high in nutrition<strong>al</strong><br />
qu<strong>al</strong>ity among cere<strong>al</strong>s, protein content is modest.<br />
Unmilled (brown) rice of 17,587 cultivars in <strong>the</strong><br />
IRRI germplasm collection averages 9.5%<br />
protein content, ranging from 4.3% to 18.2%.<br />
Environment<strong>al</strong> factors (soil fertility, w<strong>et</strong> or<br />
dry season, solar radiation, and temperature during<br />
grain development) and crop management<br />
(added N fertilizer, plant spacing) affect rice protein<br />
content. Breeding ef<strong>for</strong>ts to increase protein<br />
have been largely unsuccessful because of <strong>the</strong><br />
considerable effects of environment and because<br />
of complex inheritance properties in <strong>the</strong> triploid<br />
endosperm tissue.<br />
<strong>Rice</strong> <strong>al</strong>so provides miner<strong>al</strong>s, vitamins, and<br />
fiber, <strong>al</strong>though <strong>al</strong>l constituents except carbohydrates<br />
are reduced by milling. Milling removes<br />
roughly 80% of <strong>the</strong> thiamine from brown rice. A<br />
precook rinse or a boiling of milled rice results<br />
in addition<strong>al</strong> loss of vitamins, especi<strong>al</strong>ly B 1<br />
.<br />
Average c<strong>al</strong>orie intake per person in some<br />
developing countries—Cambodia and<br />
Madagascar—is as low as 2,000/day, while in<br />
some developed countries such as <strong>the</strong> U.S., it<br />
reaches <strong>al</strong><strong>most</strong> twice that amount. The proportion<br />
that c<strong>al</strong>ories from rice make of <strong>the</strong> tot<strong>al</strong><br />
c<strong>al</strong>orie intake <strong>al</strong>so varies greatly, from threequarters<br />
in developing countries such as<br />
Bangladesh and Cambodia to only 2% in Turkey,<br />
Mexico, and <strong>the</strong> <strong>for</strong>mer USSR countries. The<br />
world average tot<strong>al</strong> c<strong>al</strong>orie intake in 1999 was<br />
2,808/person/day, of which rice made up 21%.<br />
The world average consumption of rice in 1999<br />
was 58 kg, with <strong>the</strong> highest intake in some Asian<br />
countries; Myanmar has <strong>the</strong> highest annu<strong>al</strong><br />
consumption at 211 kg/person (Table 5).<br />
<strong>Rice</strong> eaters and growers constitute <strong>the</strong> bulk<br />
of <strong>the</strong> world’s poor: according to <strong>the</strong> UNDP<br />
Human Development Report <strong>for</strong> 1997,<br />
approximately 70% of <strong>the</strong> world’s 1.3 billion<br />
poor people live in Asia, where rice is <strong>the</strong> staple<br />
food. To some extent, this reflects Asia’s large<br />
population, but even in relative terms<br />
m<strong>al</strong>nutrition appears to affect a substanti<strong>al</strong>ly<br />
larger share of <strong>the</strong> population in South Asia than<br />
in Africa. For <strong>the</strong>se people, rice is <strong>the</strong> <strong>most</strong><br />
<strong>important</strong> commodity in <strong>the</strong>ir daily lives. In<br />
countries such as Bangladesh, Vi<strong>et</strong>nam, and<br />
Myanmar, <strong>the</strong> average citizen consumes 150–200<br />
kg annu<strong>al</strong>ly, which accounts <strong>for</strong> two-thirds or<br />
more of c<strong>al</strong>oric intake and approximately 60% of<br />
6 <strong>Rice</strong> <strong>al</strong>manac


