

Maclean et al. - 2002 - Rice almanac source book for the most important e
Maclean et al. - 2002 - Rice almanac source book for the most important e
Maclean et al. - 2002 - Rice almanac source book for the most important e

Create successful ePaper yourself
Turn your PDF publications into a flip-book with our unique Google optimized e-Paper software.
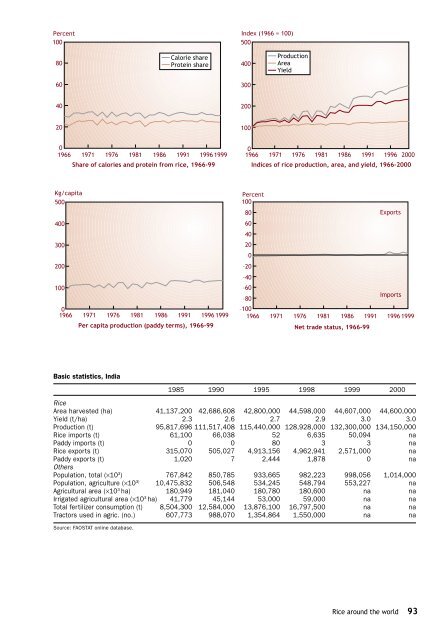
Percent<br />
100<br />
Index (1966 = 100)<br />
500<br />
80<br />
C<strong>al</strong>orie share<br />
Protein share<br />
400<br />
Production<br />
Area<br />
Yield<br />
60<br />
300<br />
40<br />
200<br />
20<br />
100<br />
0<br />
1966 1971 1976 1981 1986 1991 1996 1999<br />
Share of c<strong>al</strong>ories and protein from rice, 1966-99<br />
0<br />
1966 1971 1976 1981 1986 1991 1996 2000<br />
Indices of rice production, area, and yield, 1966-2000<br />
Kg/capita<br />
500<br />
400<br />
300<br />
200<br />
100<br />
0<br />
1966 1971 1976 1981 1986 1991 1996 1999<br />
Per capita production (paddy terms), 1966-99<br />
Percent<br />
100<br />
80<br />
Exports<br />
60<br />
40<br />
20<br />
0<br />
–20<br />
–40<br />
–60<br />
Imports<br />
–80<br />
–100<br />
1966 1971 1976 1981 1986 1991 1996 1999<br />
N<strong>et</strong> trade status, 1966-99<br />
Basic statistics, India<br />
1985 1990 1995 1998 1999 2000<br />
<strong>Rice</strong><br />
Area harvested (ha) 41,137,200 42,686,608 42,800,000 44,598,000 44,607,000 44,600,000<br />
Yield (t/ha) 2.3 2.6 2.7 2.9 3.0 3.0<br />
Production (t) 95,817,696 111,517,408 115,440,000 128,928,000 132,300,000 134,150,000<br />
<strong>Rice</strong> imports (t) 61,100 66,038 526,635 50,094 na<br />
Paddy imports (t) 0 0 80 3 3 na<br />
<strong>Rice</strong> exports (t) 315,070 505,027 4,913,156 4,962,941 2,571,000 na<br />
Paddy exports (t) 1,020 7 2,444 1,878 0 na<br />
O<strong>the</strong>rs<br />
Population, tot<strong>al</strong> (×10 3 ) 767,842 850,785 933,665 982,223 998,056 1,014,000<br />
Population, agriculture (×10 3) 10,475,832 506,548 534,245 548,794 553,227 na<br />
Agricultur<strong>al</strong> area (×10 3 ha) 180,949 181,040 180,780 180,600 na na<br />
Irrigated agricultur<strong>al</strong> area (×10 3 ha) 41,779 45,144 53,000 59,000 na na<br />
Tot<strong>al</strong> fertilizer consumption (t) 8,504,300 12,584,000 13,876,100 16,797,500 na na<br />
Tractors used in agric. (no.) 607,773 988,070 1,354,864 1,550,000 na na<br />
Source: FAOSTAT online database.<br />
<strong>Rice</strong> around <strong>the</strong> world 93


